14 CloudLab Kubernetes Tutorial
This tutorial will walk you through the process of creating a Kubernetes cluster on CloudLab. Your copy of Kubernetes will run on bare-metal machines that are dedicated for your use for the duration of your experiment. You will have complete administrative access to these machines, meaning that you have full ability to customize and/or configure your installation of Kubernetes.
14.1 Objectives
In the process of taking this tutorial, you will learn to:
Log in to CloudLab
Create your own cloud by using a pre-defined profile
Access resources in a cloud that you create
Use administrative access to customize your cloud
Clean up your cloud when finished
Learn where to get more information
14.2 Prerequisites
This tutorial assumes that:
You have an existing account on CloudLab. Instructions for getting an account can be found here.)
16.4 Logging In
If you have signed up for an account at the CloudLab website, simply open https://www.cloudlab.us/ in your browser, click the “Log In” button, enter your username and password.
14.4 Building Your Own Kubernetes Cluter
Once you have logged in to CloudLab, you will “instantiate” a “profile” to create an experiment. Profiles are CloudLab’s way of packaging up configurations and experiments so that they can be shared with others. Each experiment is separate: the experiment that you create for this tutorial will be an instance of a profile provided by the facility, but running on resources that are dedicated to you, which you have complete control over. This profile uses local disk space on the nodes, so anything you store there will be lost when the experiment terminates.
The Kubernetes cluster we will build in this tutorial is very small, but CloudLab has additional hardware that can be used for larger-scale experiments.
For this tutorial, we will use a basic profile that brings up a small Kubernetes cluster. The CloudLab staff have built this profile by creating a set of scripts that install Kubernetes using the kubespray package, but customized for the CloudLab environment (adjusting it to the specific machines that will get allocated, the user that created it, etc.) See this manual’s section on profiles for more information about how they work.
- Start Experiment
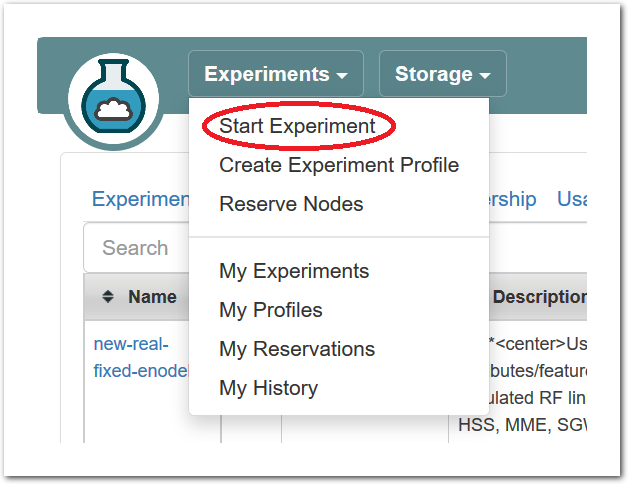 After logging in, you are taken to your main status dashboard. Select “Start Experiment” from the “Experiments” menu.
 - Select a profile
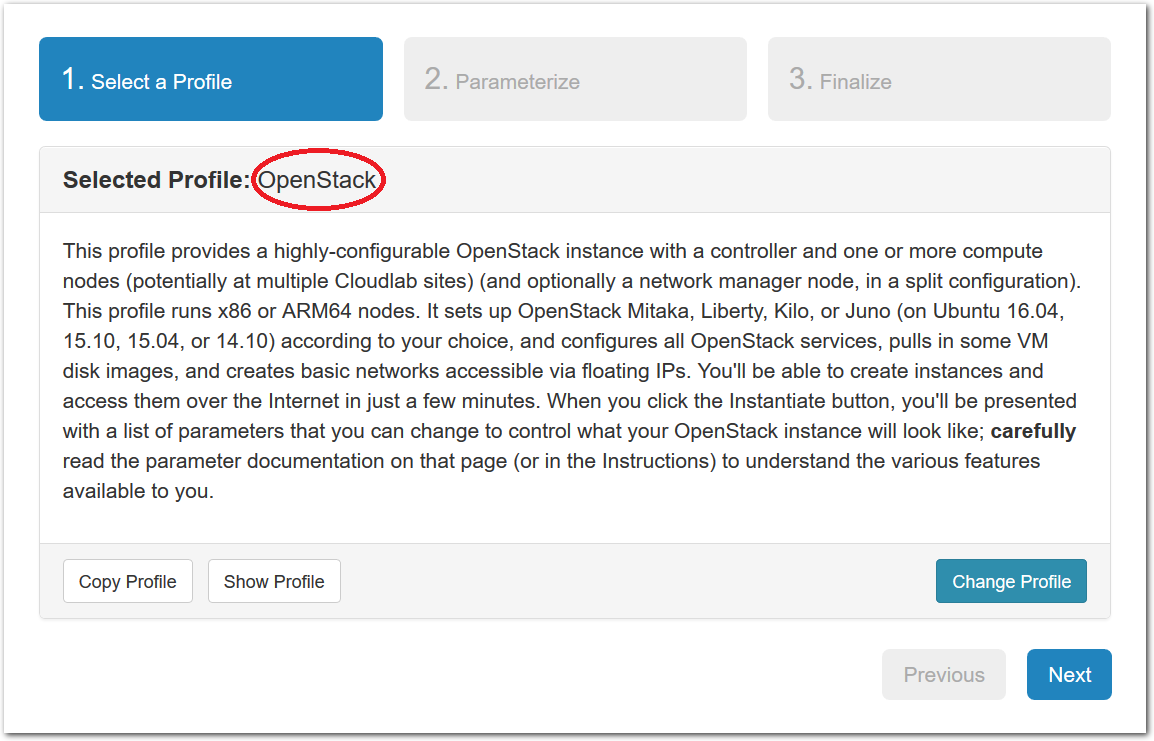 The “Start an Experiment” page is where you will select a profile to instantiate. We will use the k8s profile. You can select that profile by using this link or clicking the “Change Profile” button, and searching for “k8s“ in the list on the left. There may be multiple profiles with “k8s” in the name, so make sure you are using the one listed as a “System” profile as shown in the screenshot below.
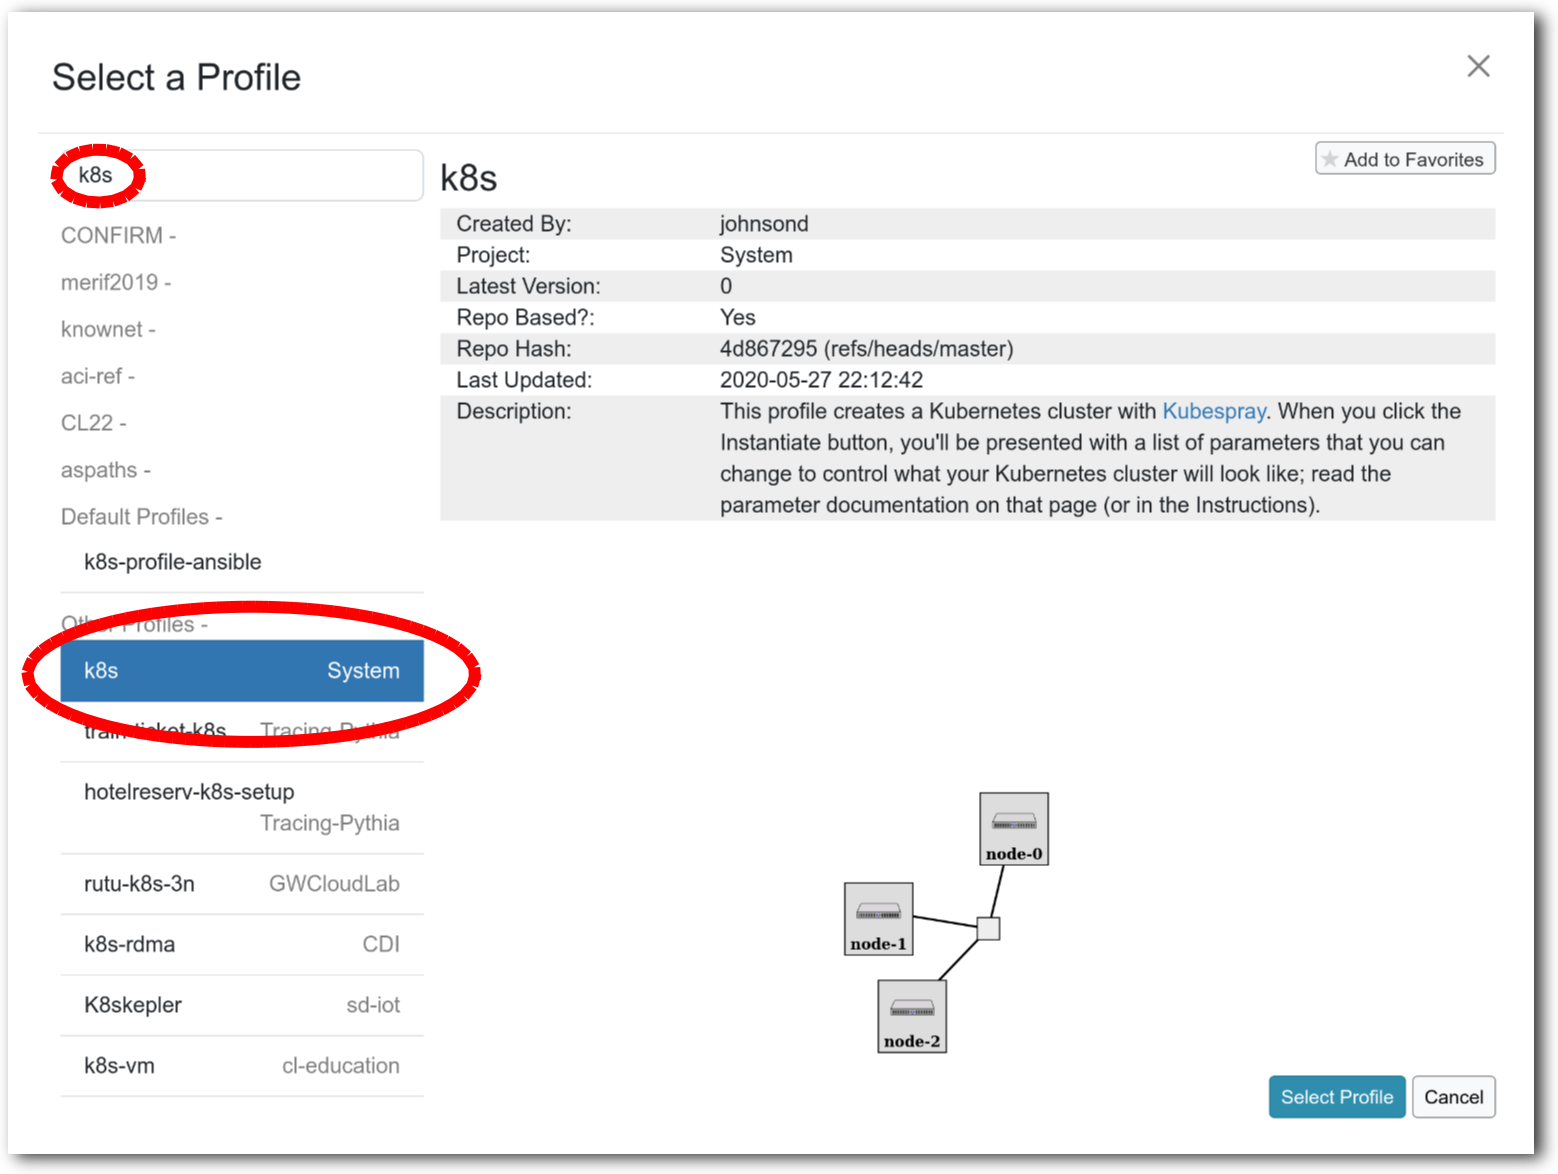
CloudLab allows its users to share their profiles, including by making them public. This is why there may be multiple “k8s” profiles listed. Profiles listed as “System” are created and supported by the CloudLab staff.
Once you have the correct profile selected, click “Next”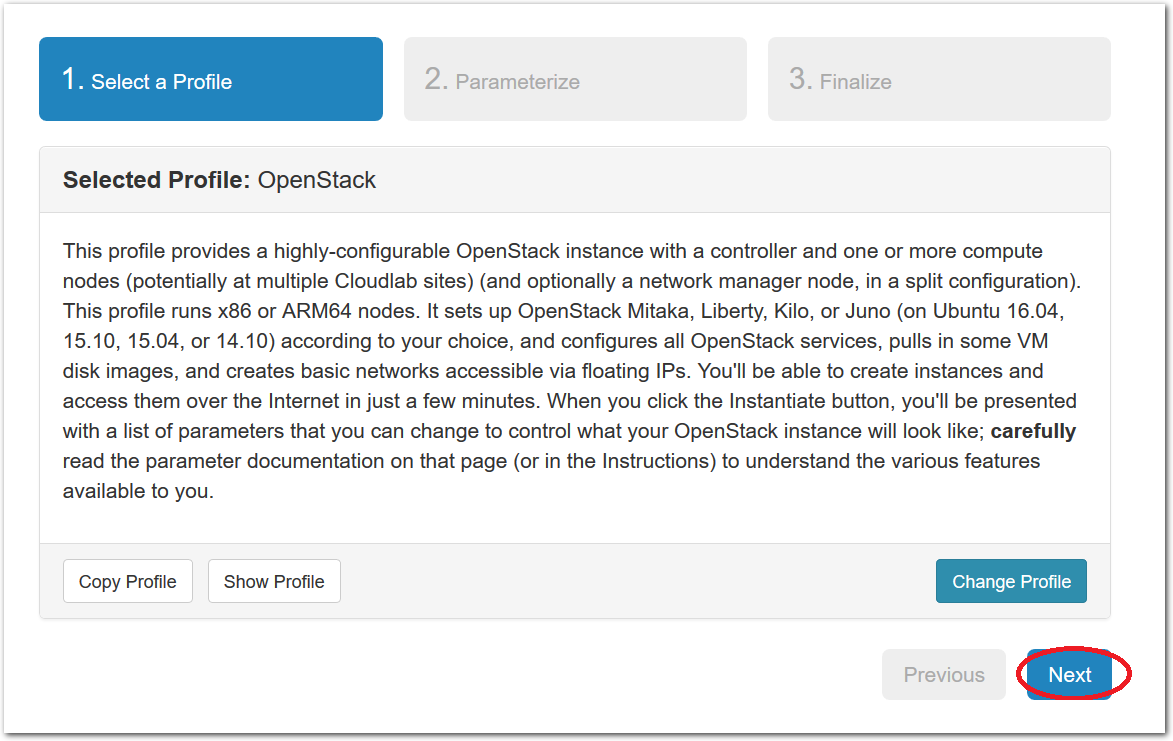
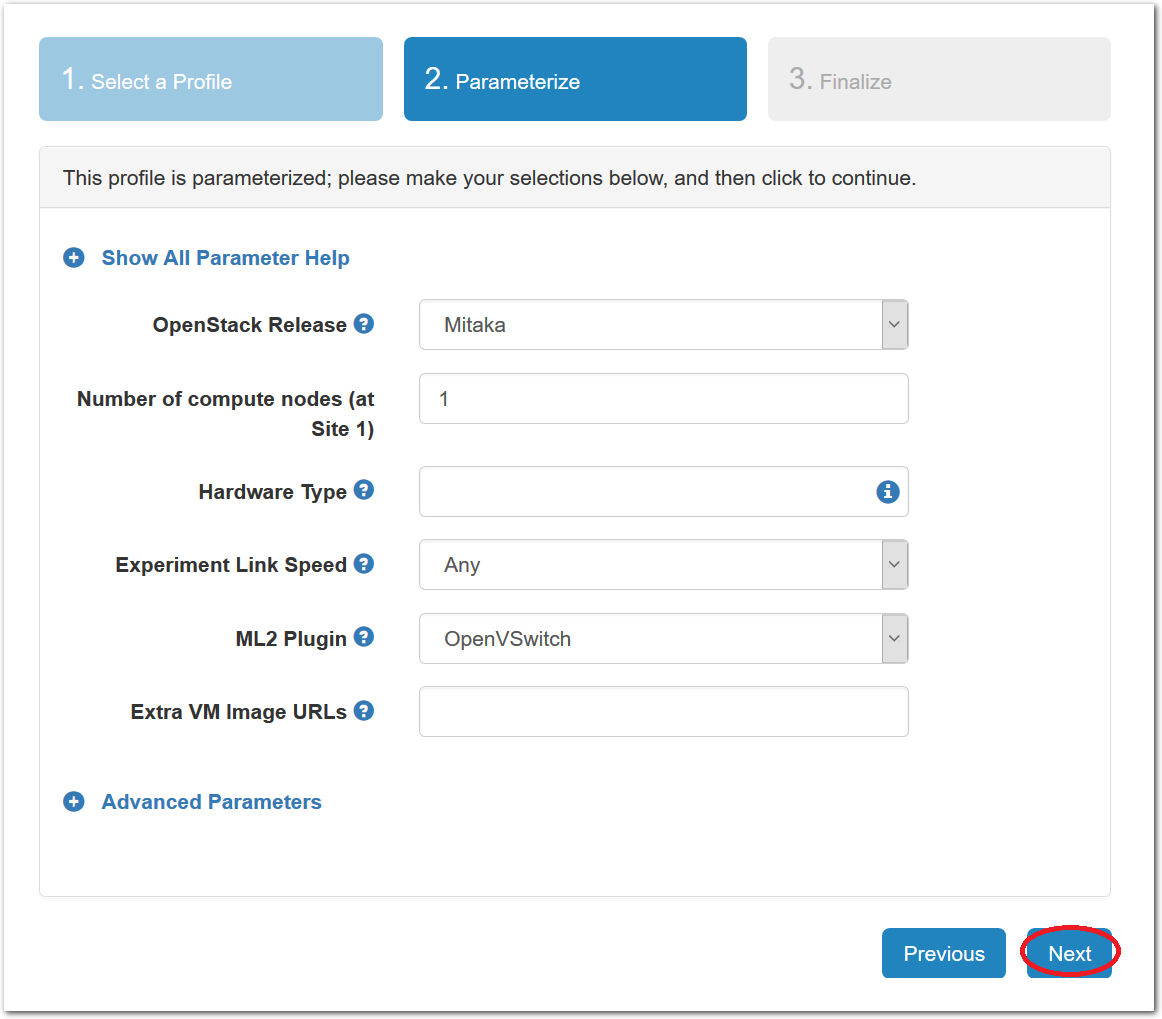
- Set parametersProfiles in CloudLab can have parameters that affect how they are configured; for example, this profile has parameters that let you control the size of your cluster and adjust many Kubernetes options.Note: If you are at an in-person tutorial, the presenter may ask you to set parameters such as the node type or number of nodes.Otherwise, you can leave all parameters at their defaults and just click “next”.
- Select a clusterCloudLab has multiple clusters available to it. Some profiles can run on any cluster, some can only run on specific ones due to specific hardware constraints, etc.
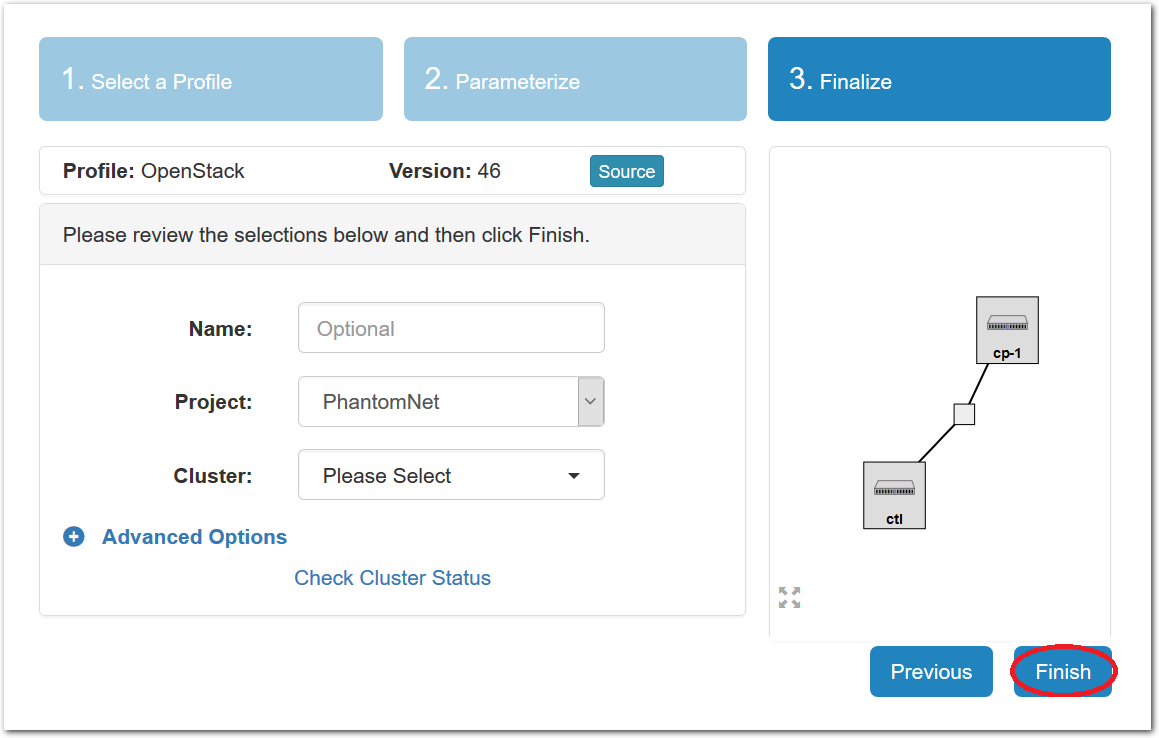
You may optionally give your experiment a name—
this can be useful if you have many experiments running at once. Note: If you are at an in-person tutorial, the instructor will tell you which cluster to select. Additionally, if you selected a node type in the parameterize step, you may not see a cluster selector - this is because most node types exist at only one cluster. Otherwise, you may select any cluster.You may see “calendar” icons in the cluster list - this indicates that you, or your project, have a reservation on that cluster. Usually, this means that’s the cluster you’ll want to select.
The dropdown menu for the clusters shows you both the health (outer ring) and available resources (inner dot) of each cluster. The “Check Cluster Status” link opens a page (in a new tab) showing the current utilization of all CloudLab clusters.
Click “Next”.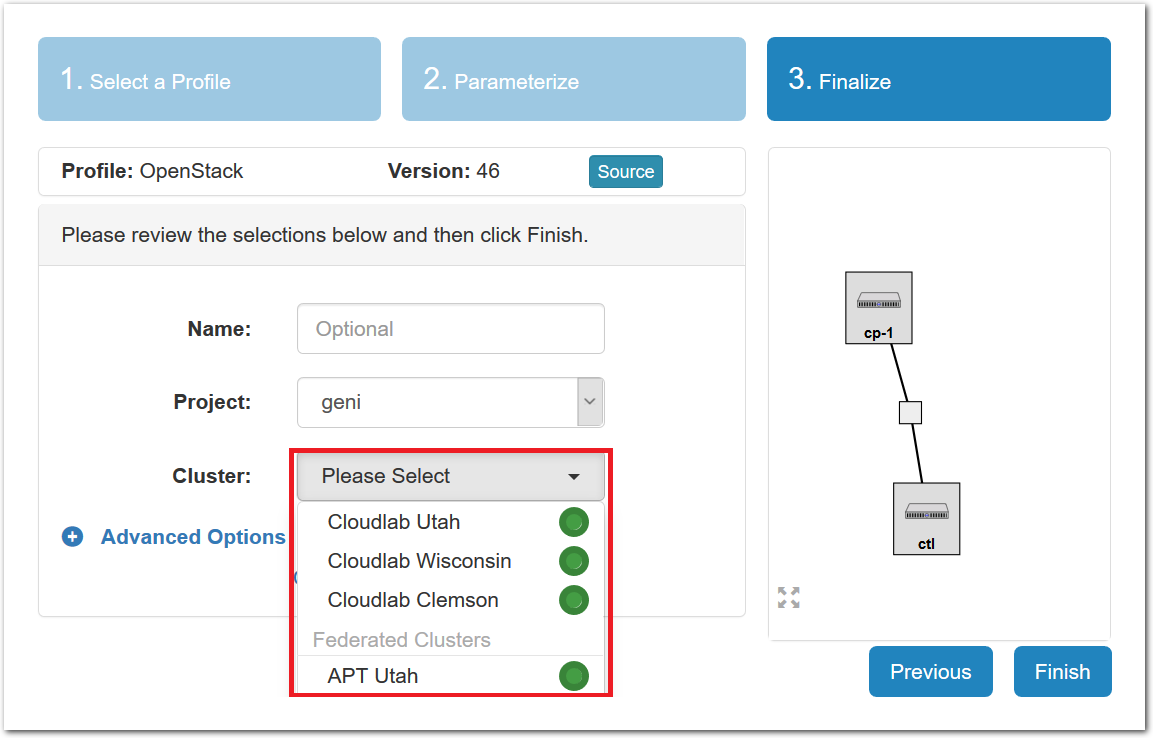
- Click Finish!CloudLab has the ability to schedule experiments to run in the future. For this tutorial, we’ll just run it right now. When you click the “finish” button, CloudLab will start provisioning the resources that you requested on the cluster that you selected.
- CloudLab instantiates your profileCloudLab will take a few minutes to bring up your copy of Kubernetes, as many things happen at this stage, including selecting suitable hardware, loading disk images on local storage, booting bare-metal machines, re-configuring the network topology, etc. While this is happening, you will see this status page:
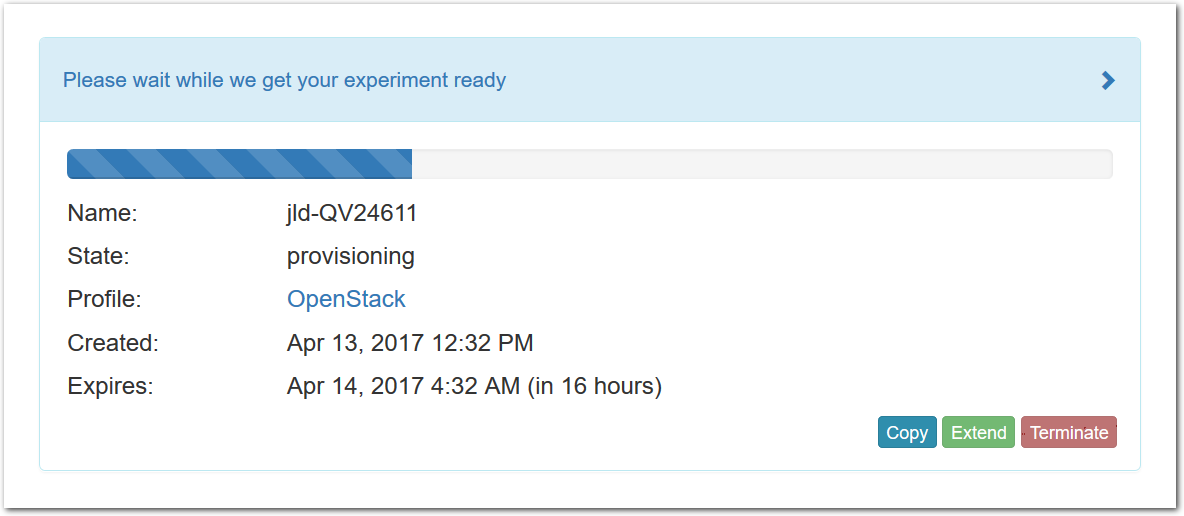 As soon as a set of resources have been assigned to you, you will see details about them at the bottom of the page (though you will not be able to log in until they have gone through the process of imaging and booting.) While you are waiting for your resources to become available, you may want to have a look at the CloudLab user manual, or use the “Logs” button to watch the logs of the resources being provisioned and booting.
 - Your cluster boots and runs startup scriptsWhen the web interface reports the state as “Booted”, this means that provisioning (such as disk imaging, network setup, and booting) is finished. This profile has startup scripts that run after the nodes boot - these may still be running when you first look at the status page. You can get details about which nodes have finished and which are still running under the “List View” tab.
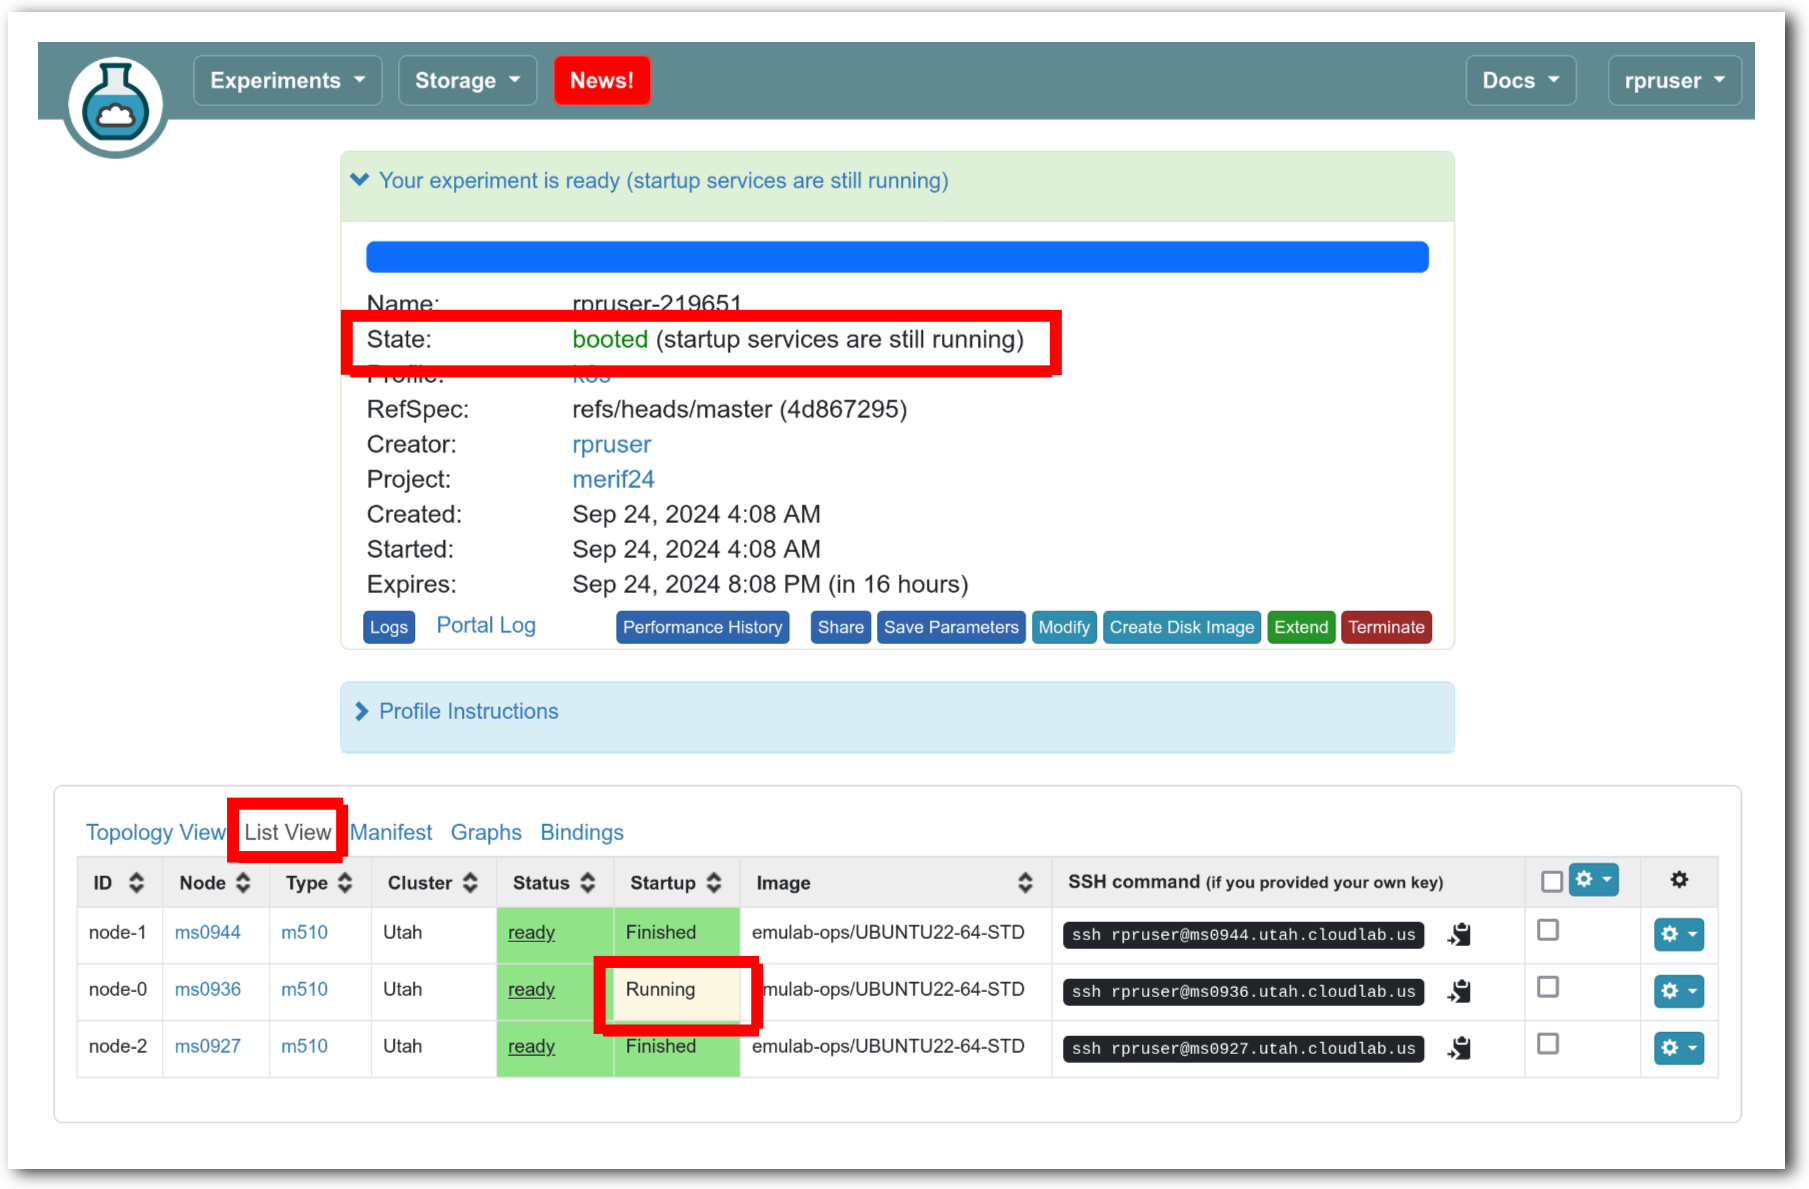
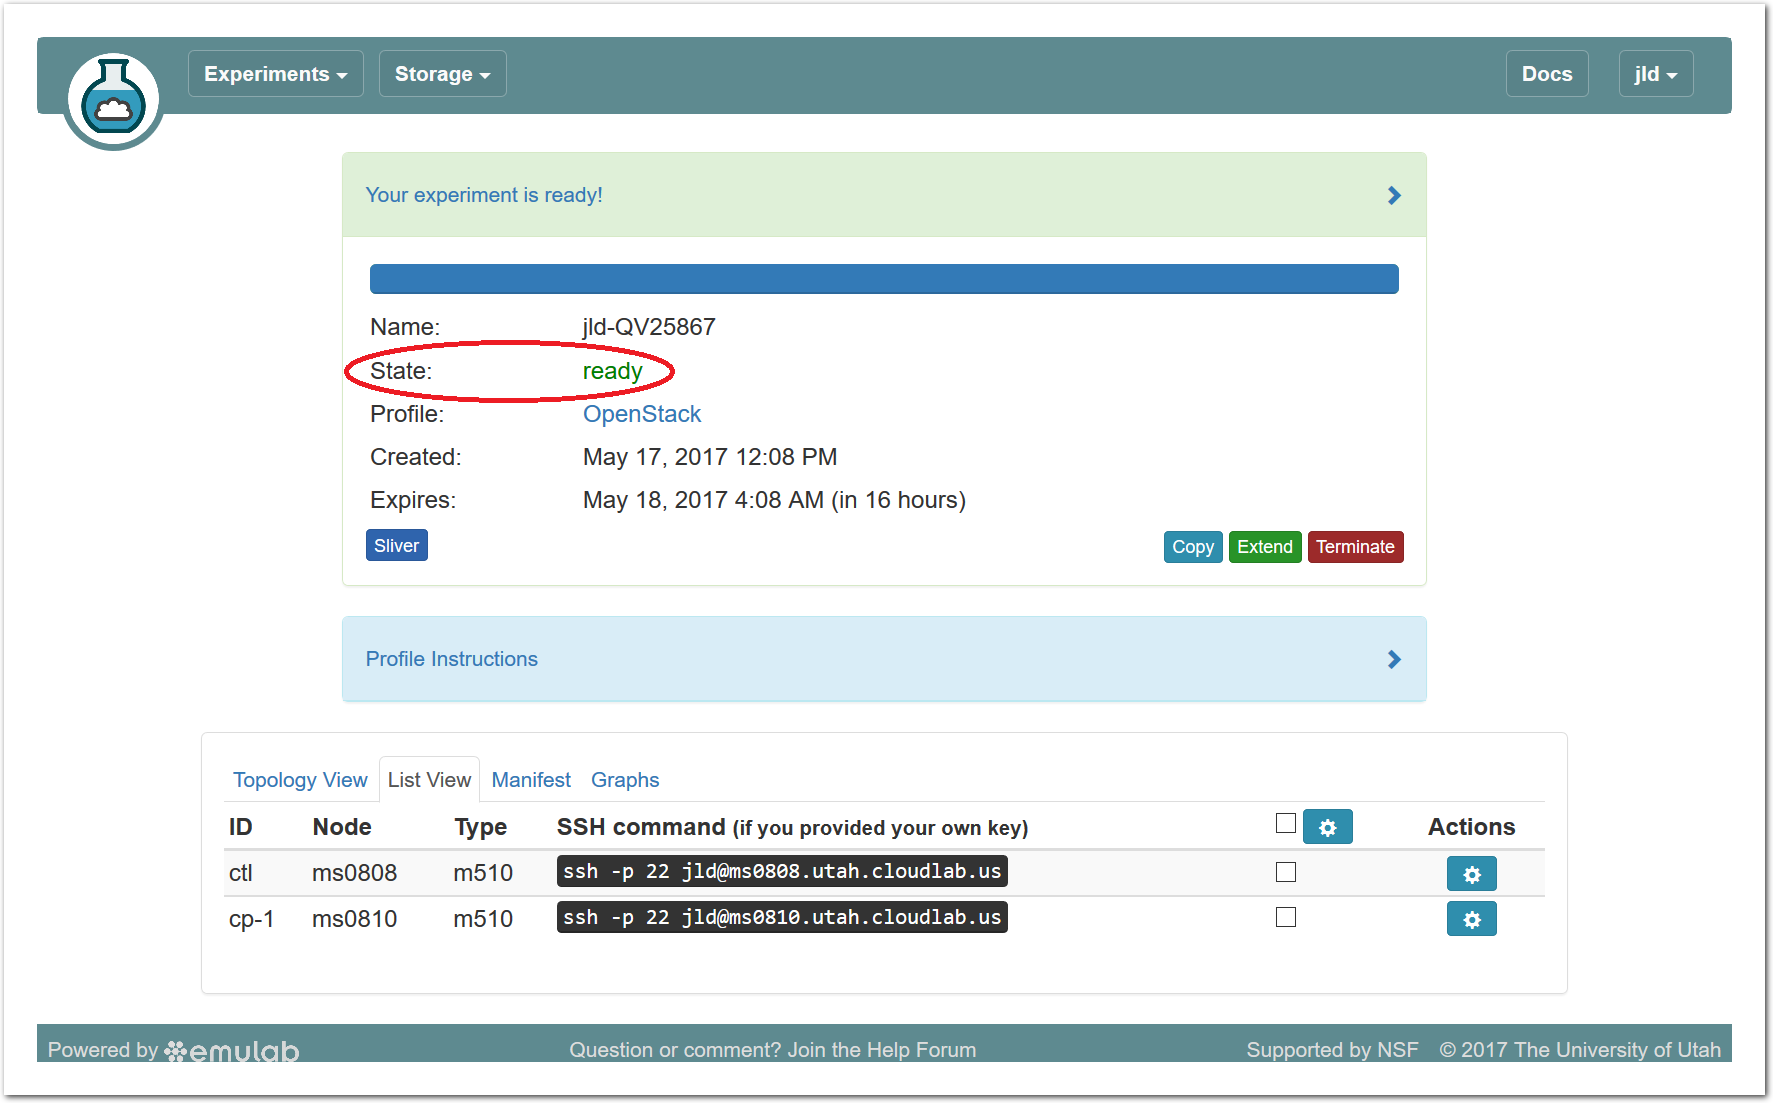
- Your cluster is ready!When the web interface reports the state as “Ready”, startup scripts are done running, and you can proceed to the next section. For now, don’t attempt to log in to Kubernetes we will explore the CloudLab experiment first.
14.5 Exploring Your Experiment
Now that your experiment is ready, take a few minutes to look at various parts of the CloudLab status page to help you understand what resources you’ve got and what you can do with them.
14.5.1 Experiment Status
The panel at the top of the page shows the status of your experiment—
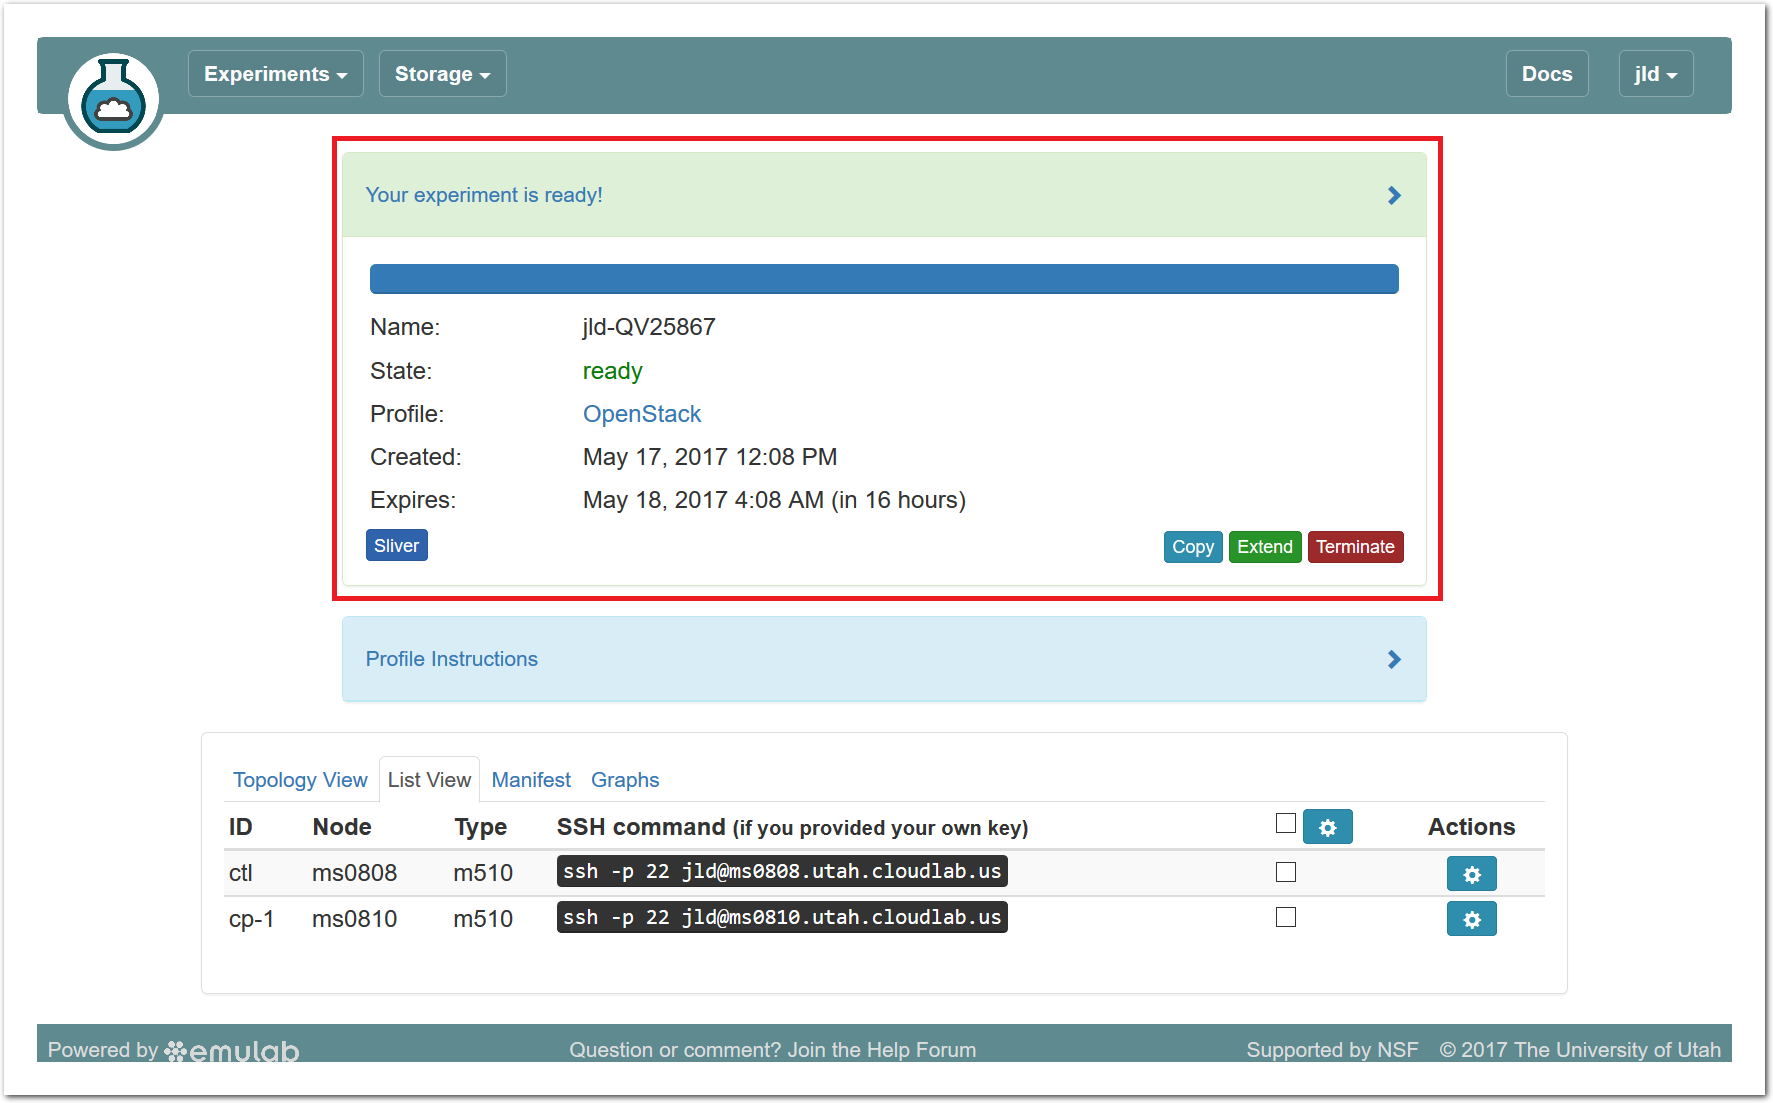
Note that the default lifetime for experiments on CloudLab is less than a day; after this time, the resources will be reclaimed and their disk contents will be lost. If you need to use them for longer, you can use the “Extend” button and provide a description of why they are needed. Longer extensions require higher levels of approval from CloudLab staff. You might also consider creating a profile of your own if you might need to run a customized environment multiple times or want to share it with others.
You can click the title of the panel to expand or collapse it.
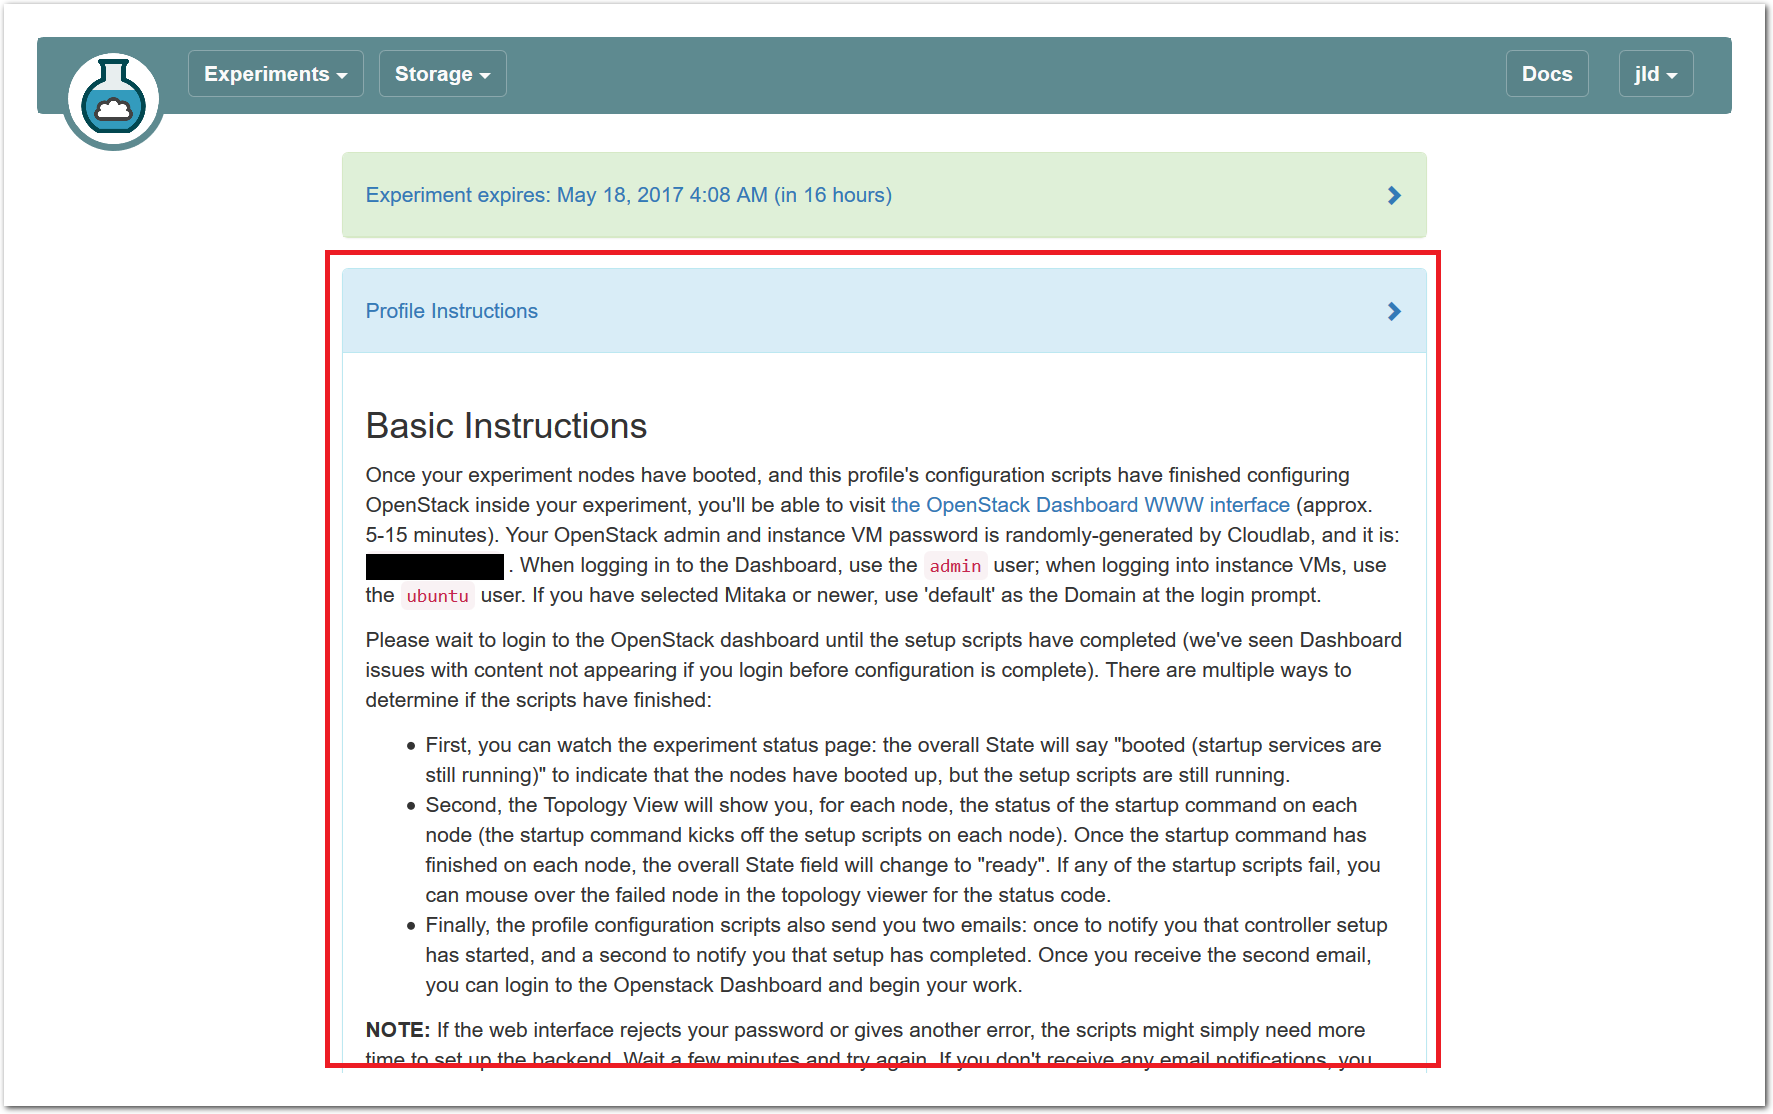
14.5.2 Profile Instructions
Profiles may contain written instructions for their use. Clicking on the title
of the “Profile Instructions” panel will expand (or collapse) it; in this
case, the instructions provide a link to the dashboard of
Kubernetes, and give you passwords to use to log in. (Don’t log into Kubernetes
yet—
14.5.3 Topology View
At the bottom of the page, you can see the topology of your experiment. This profile has three nodes connected by a LAN, which is represented by a gray box in the middle of the topology. The names given for each node are the names assigned as part of the profile; this way, every time you instantiate a profile, you can refer to the nodes using the same names, regardless of which physical hardware was assigned to them. The green boxes around each node indicate that they are up; click the “Refresh Status” button to initiate a fresh check.
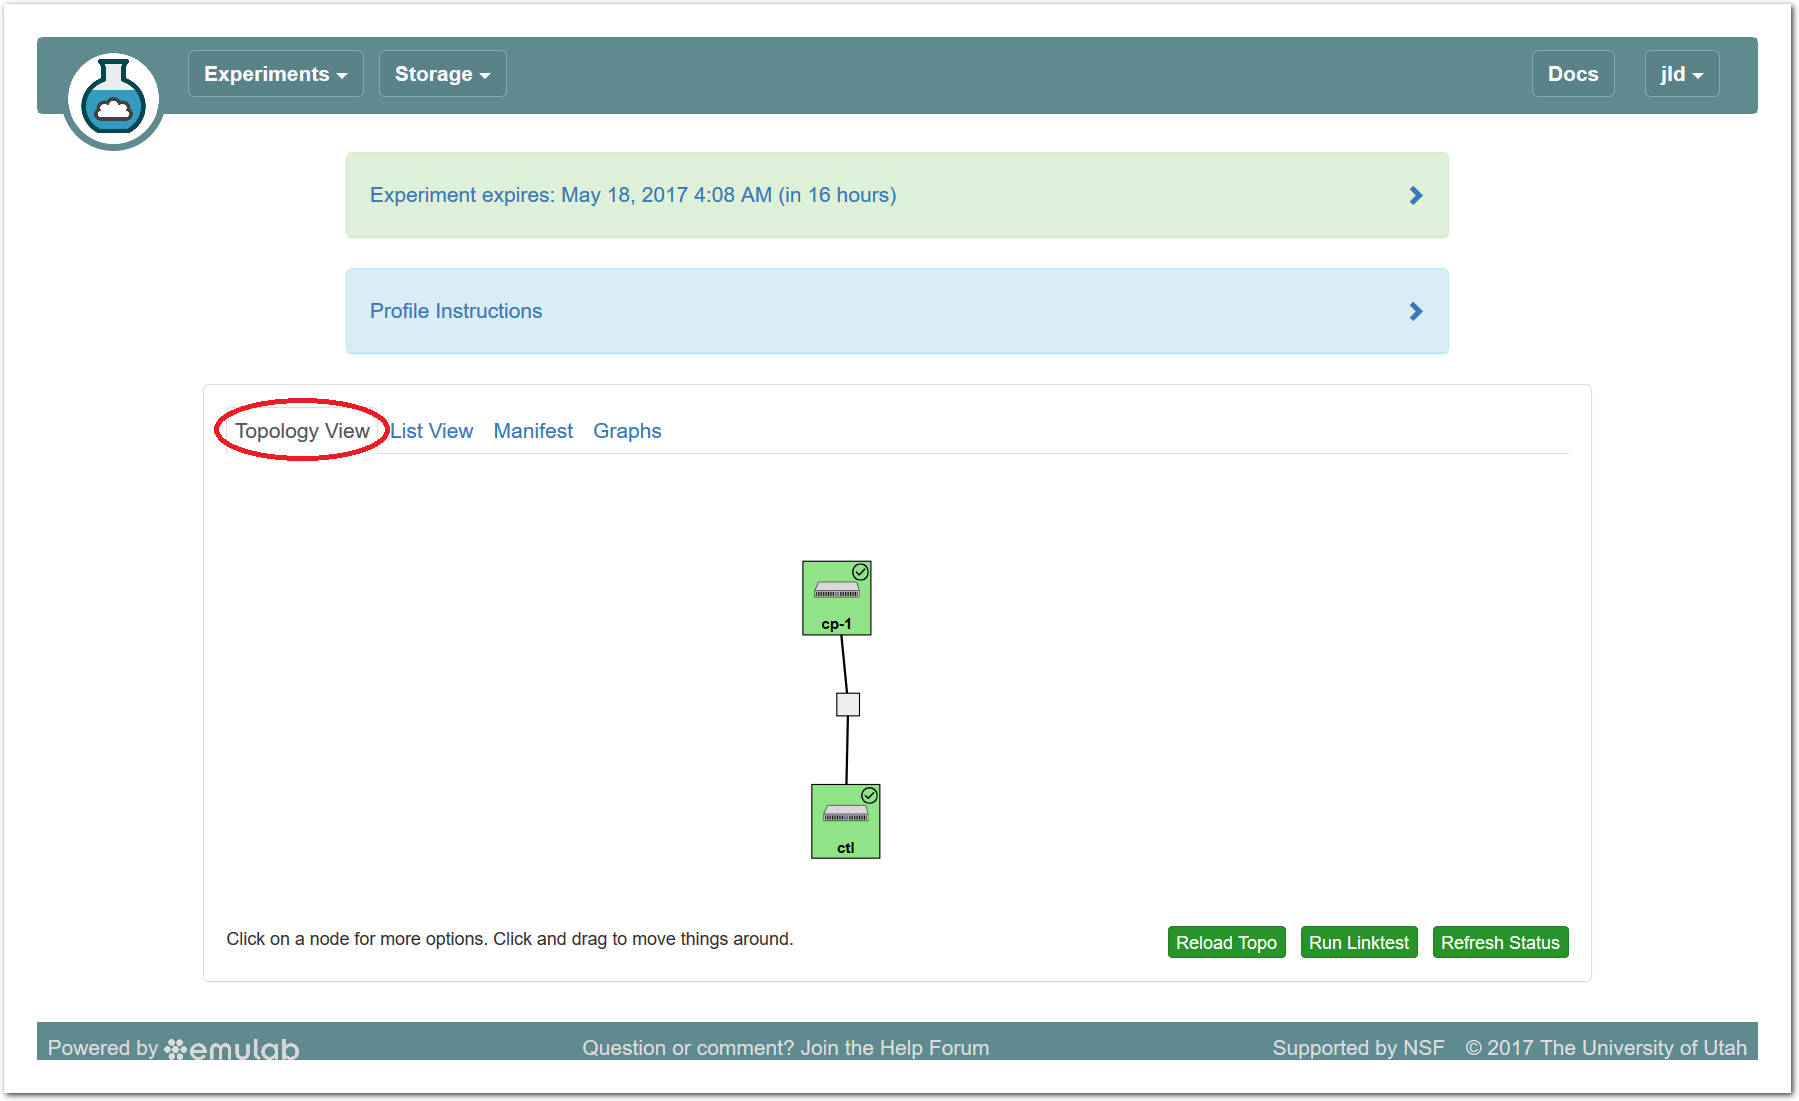
If an experiment has “startup services” (programs that run at the beginning of the experiment to set it up), their status is indicated by a small icon in the upper right corner of the node. You can mouse over this icon to see a description of the current status. In this profile, the startup services on the compute node(s) typically complete quickly, but the control node may take much longer.
It is important to note that every node in CloudLab has at least two network interfaces: one “control network” that carries public IP connectivity, and one “experiment network” that is isolated from the Internet and all other experiments. It is the experiment net that is shown in this topology view. You will use the control network to ssh into your nodes, interact with their web interfaces, etc. This separation gives you more freedom and control in the private experiment network, and sets up a clean environment for repeatable research.
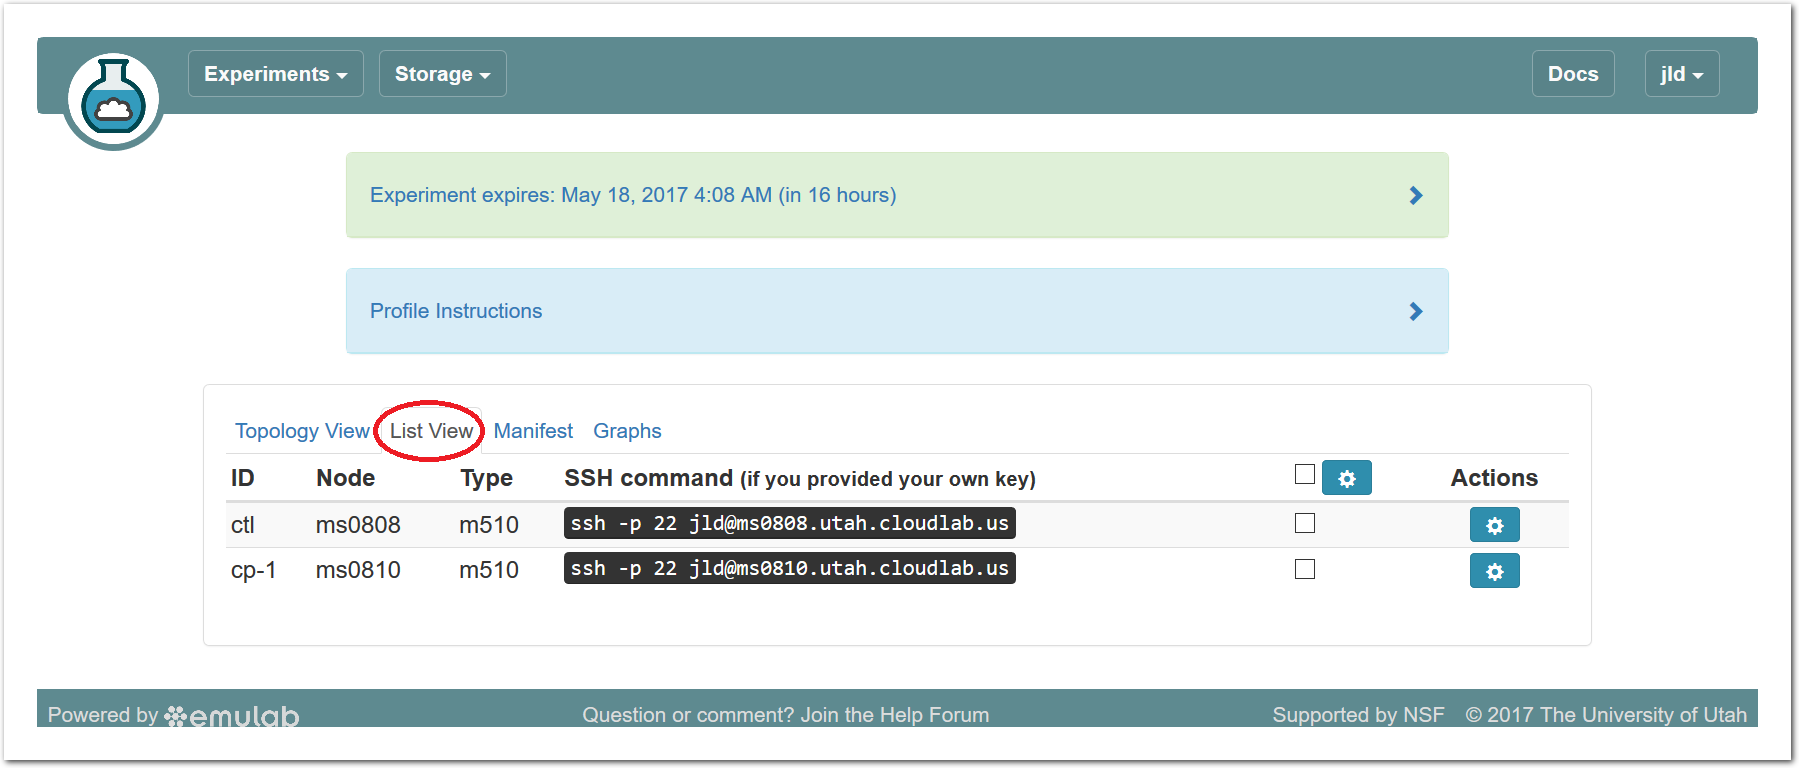
14.5.4 List View
The list view tab shows similar information to the topology view, but in a different format. It shows the identities of the nodes you have been assigned, and the full ssh command lines to connect to them. In some browsers (those that support the ssh:// URL scheme), you can click on the SSH commands to automatically open a new session. On others, you may need to cut and paste this command into a terminal window. Note that only public-key authentication is supported, and you must have set up an ssh keypair on your account before starting the experiment in order for authentication to work.
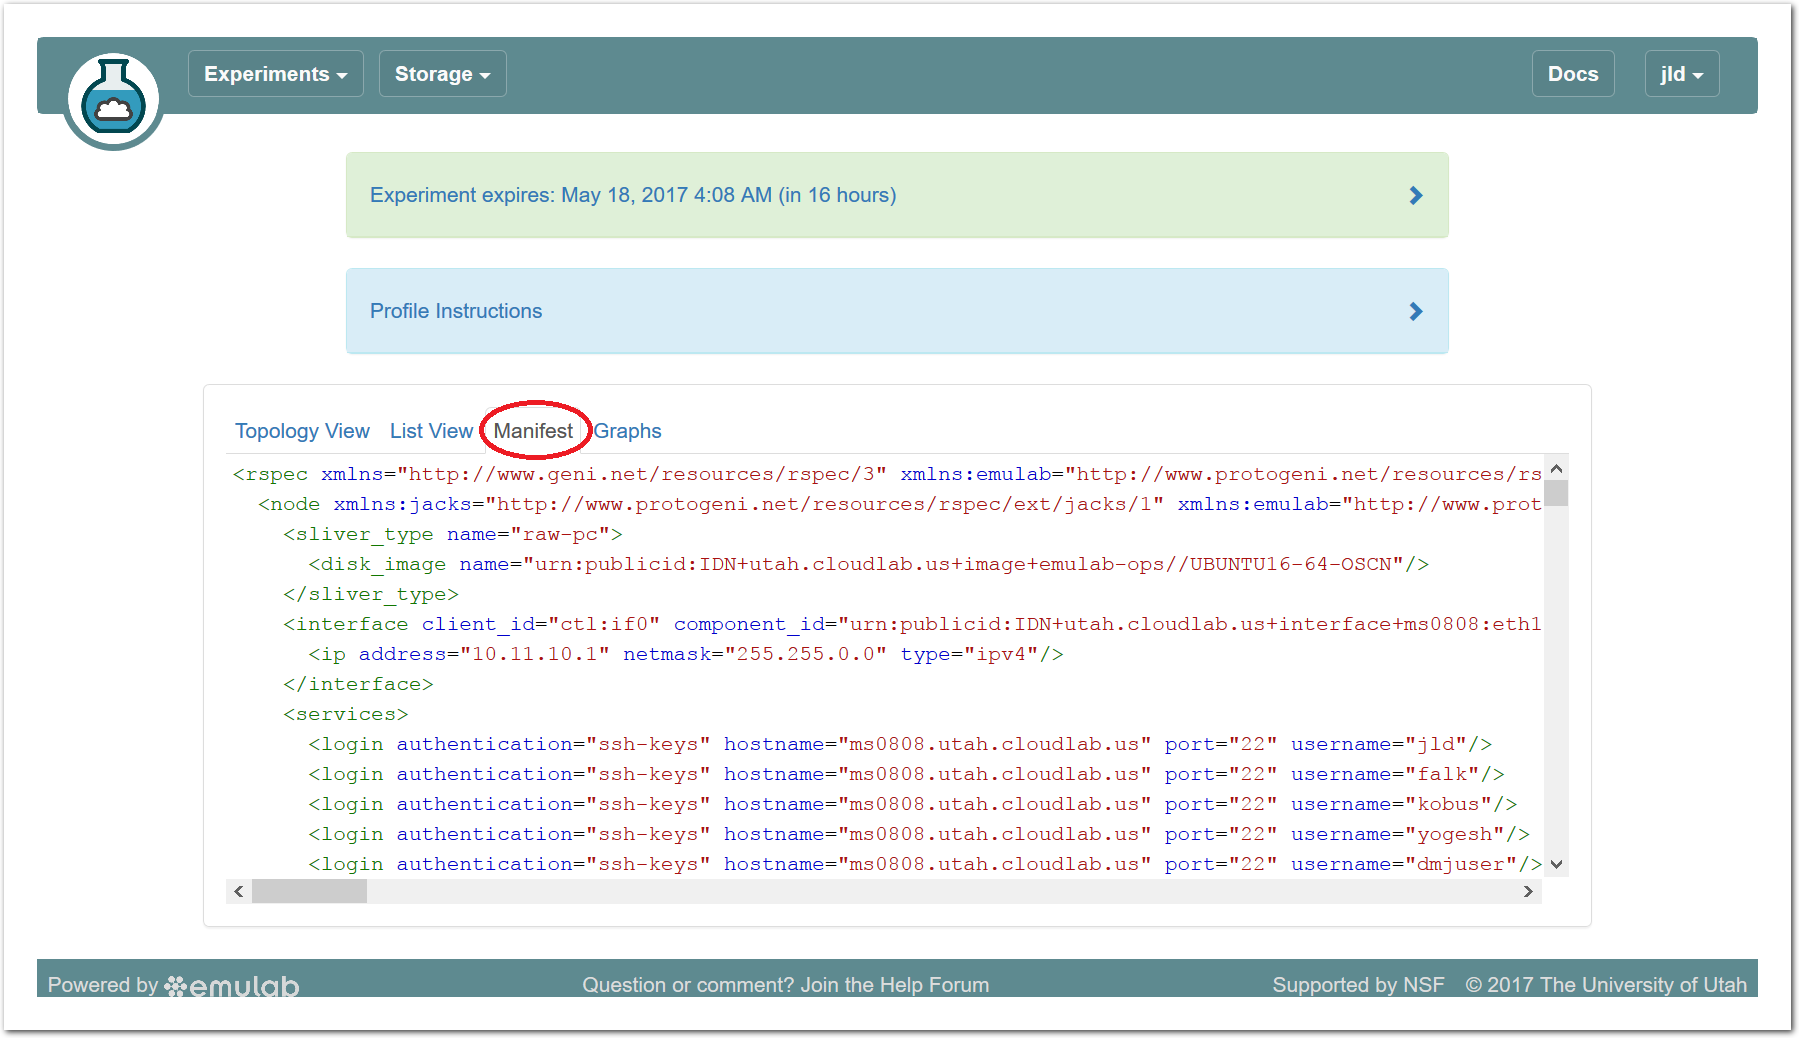
14.5.5 Manifest View
The third default tab shows a manifest detailing the hardware that has been assigned to you. This is the “request” RSpec that is used to define the profile, annotated with details of the hardware that was chosen to instantiate your request. This information is available on the nodes themselves using the geni-get command, enabling you to do rich scripting that is fully aware of both the requested topology and assigned resources.
Most of the information displayed on the CloudLab status page comes directly from this manifest; it is parsed and laid out in-browser.
14.5.6 Graphs View
The final default tab shows a page of CPU load and network traffic graphs for the nodes in your experiment. On a freshly-created experiment, it may take several minutes for the first data to appear. After clicking on the “Graphs” tab the first time, a small reload icon will appear on the tab, which you can click to refresh the data and regenerate the graphs. For instance, here is the load average graph for an experiment running for over 6 hours. Scroll past this screenshot to see the control and experiment network traffic graphs. In your experiment, you’ll want to wait 20-30 minutes before expecting to see anything interesting.
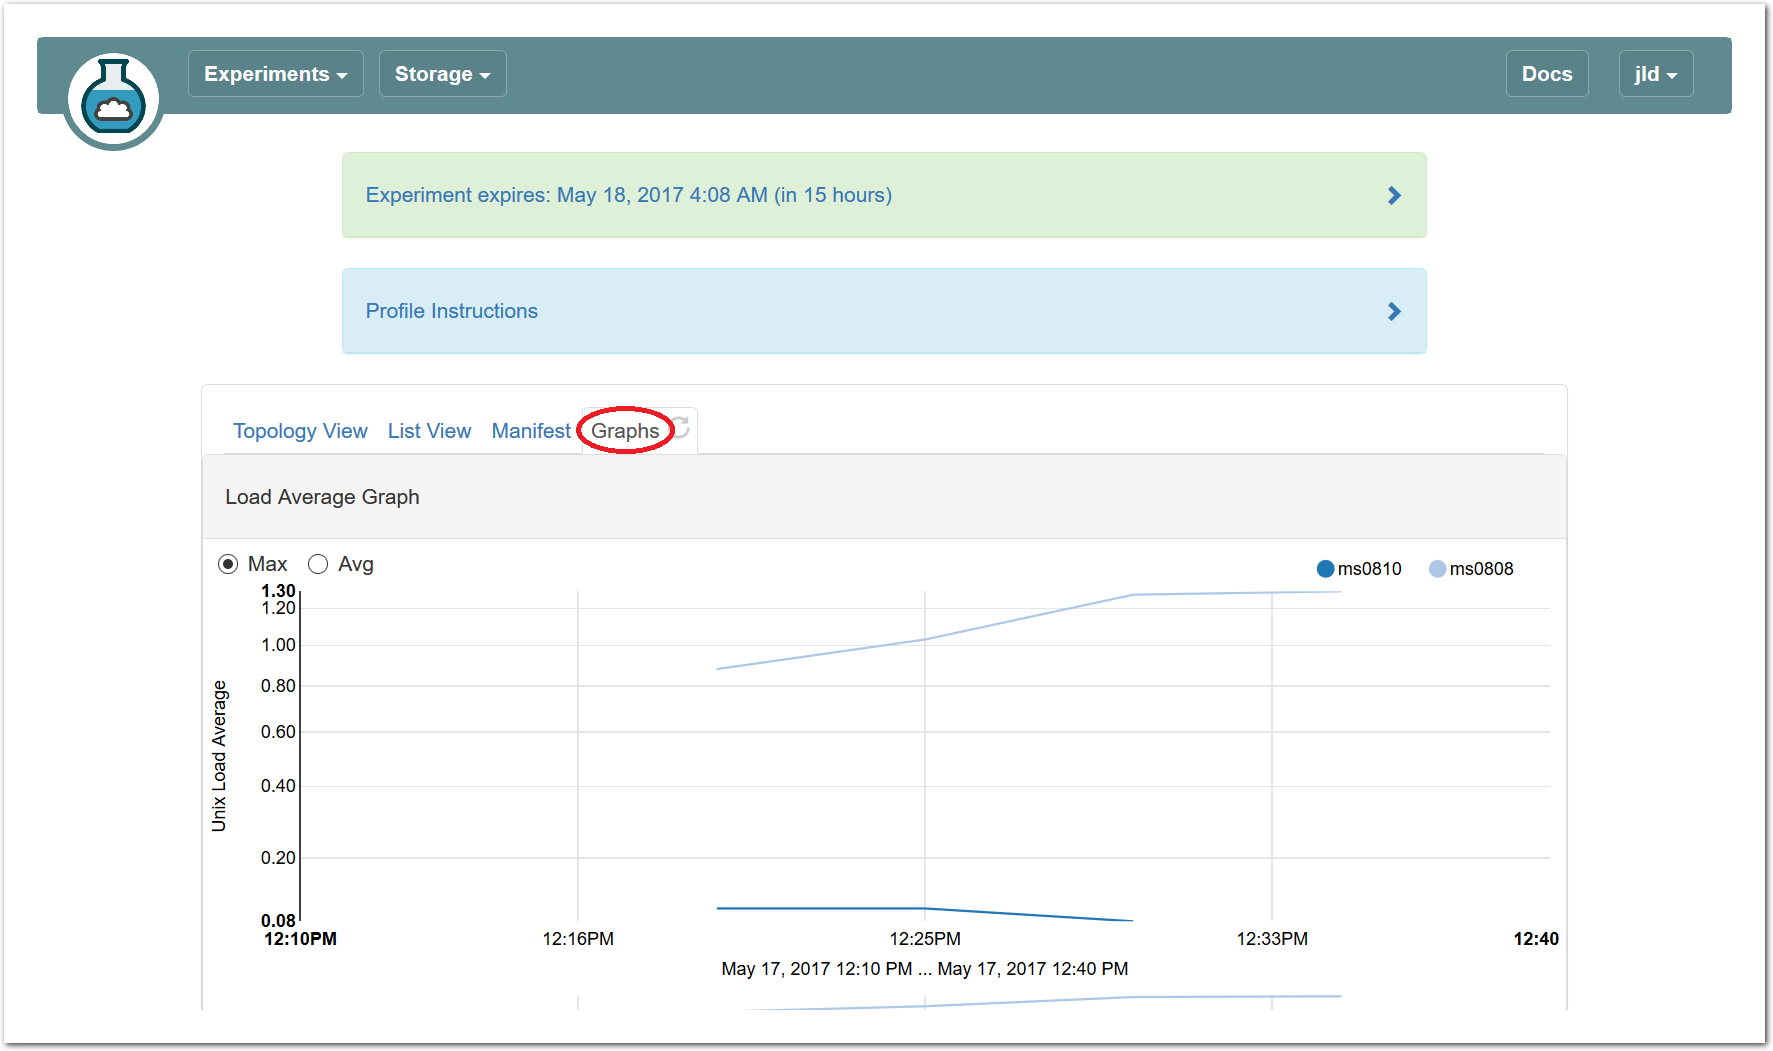
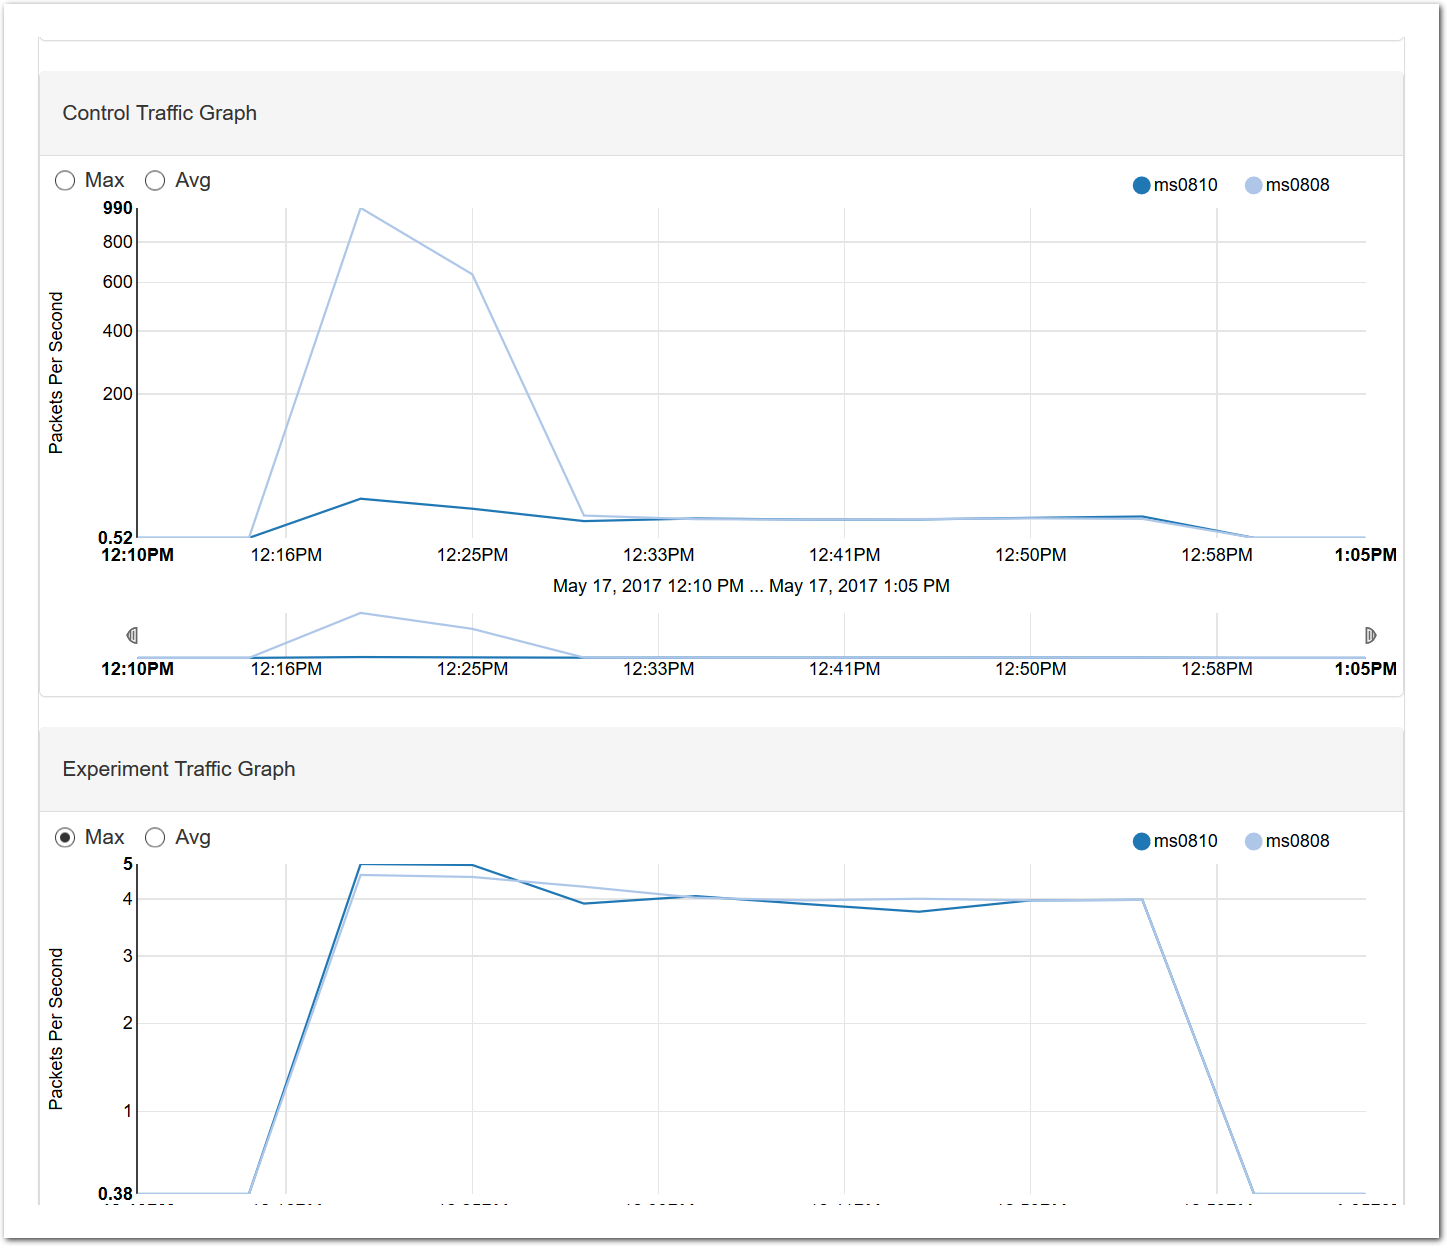
Here are the control network and experiment network packet graphs at the same time. The spikes at the beginning are produced by the initial profile setup and, as well as the simple tasks you’ll perform later in this profile.
14.5.7 Actions
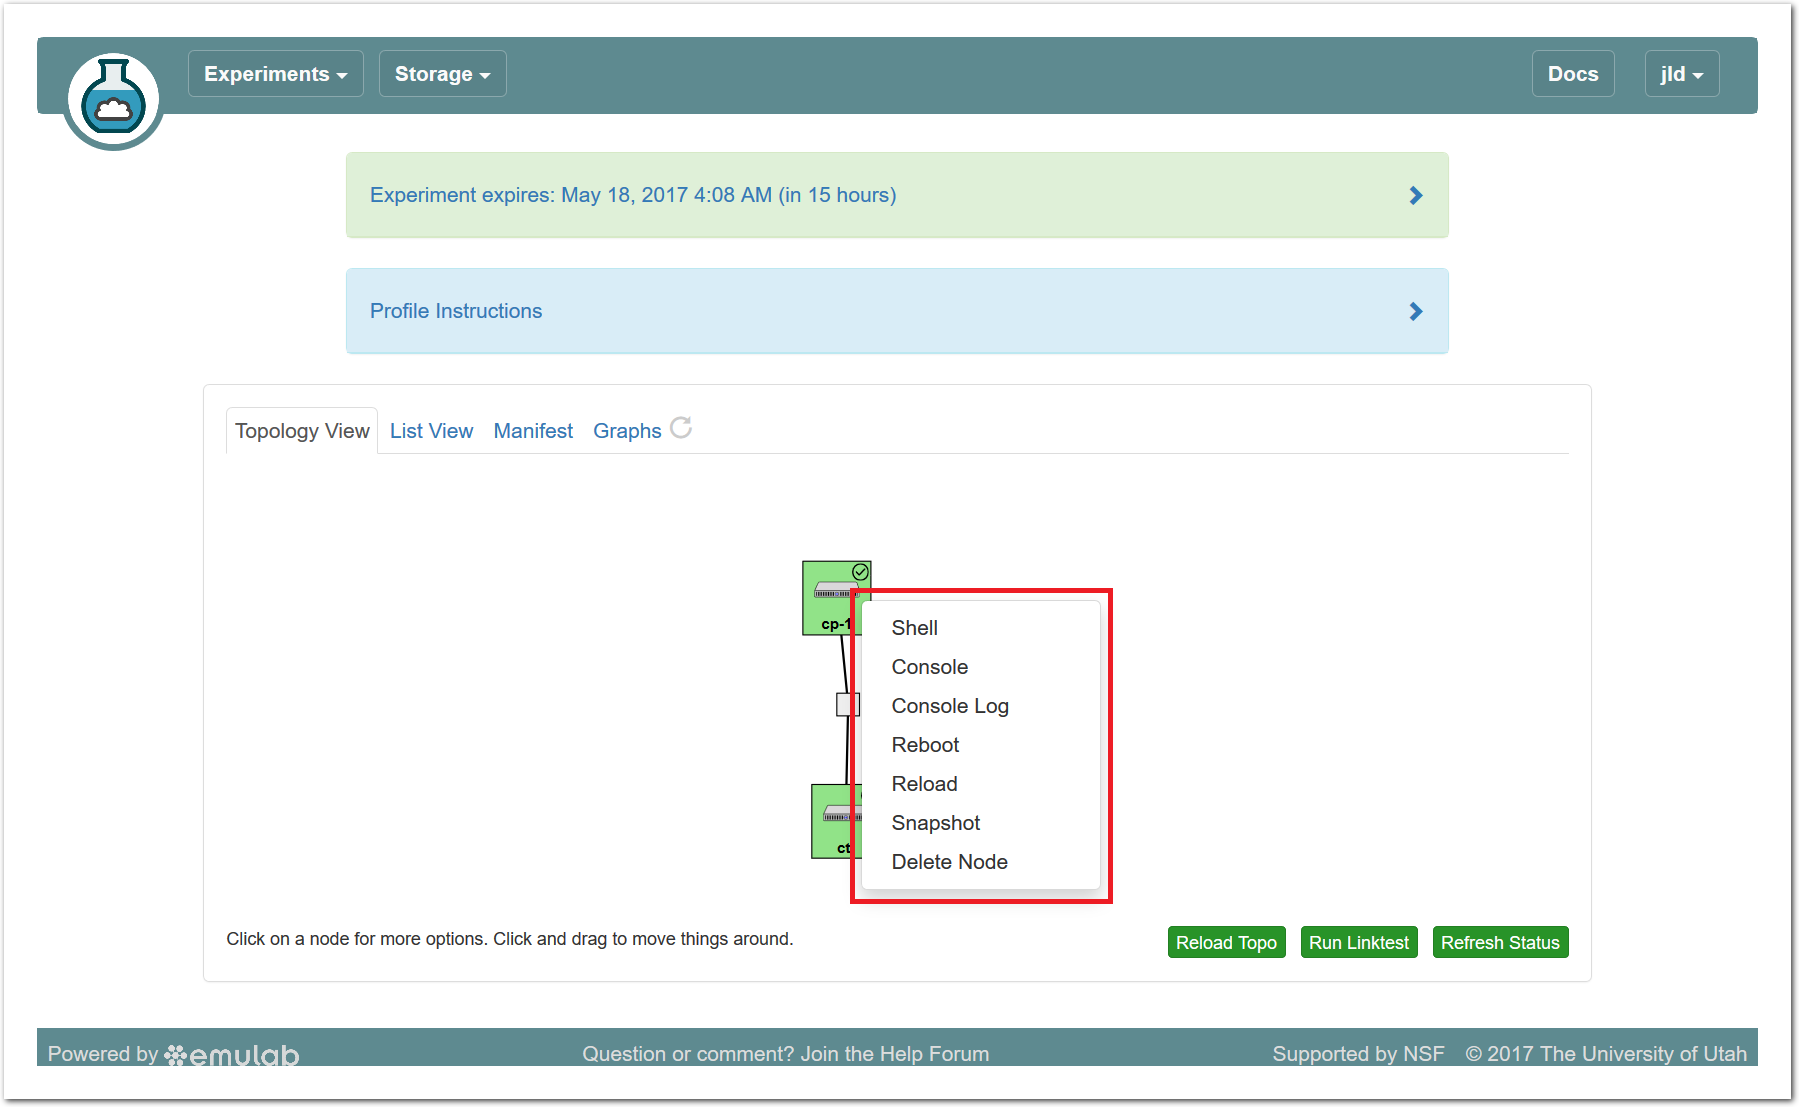
In both the topology and list views, you have access to several actions that you may take on individual nodes. In the topology view, click on the node to access this menu; in the list view, it is accessed through the icon in the “Actions” column. Available actions include rebooting (power cycling) a node, and re-loading it with a fresh copy of its disk image (destroying all data on the node). While nodes are in the process of rebooting or re-imaging, they will turn yellow in the topology view. When they have completed, they will become green again. The shell and console actions are described in more detail below.
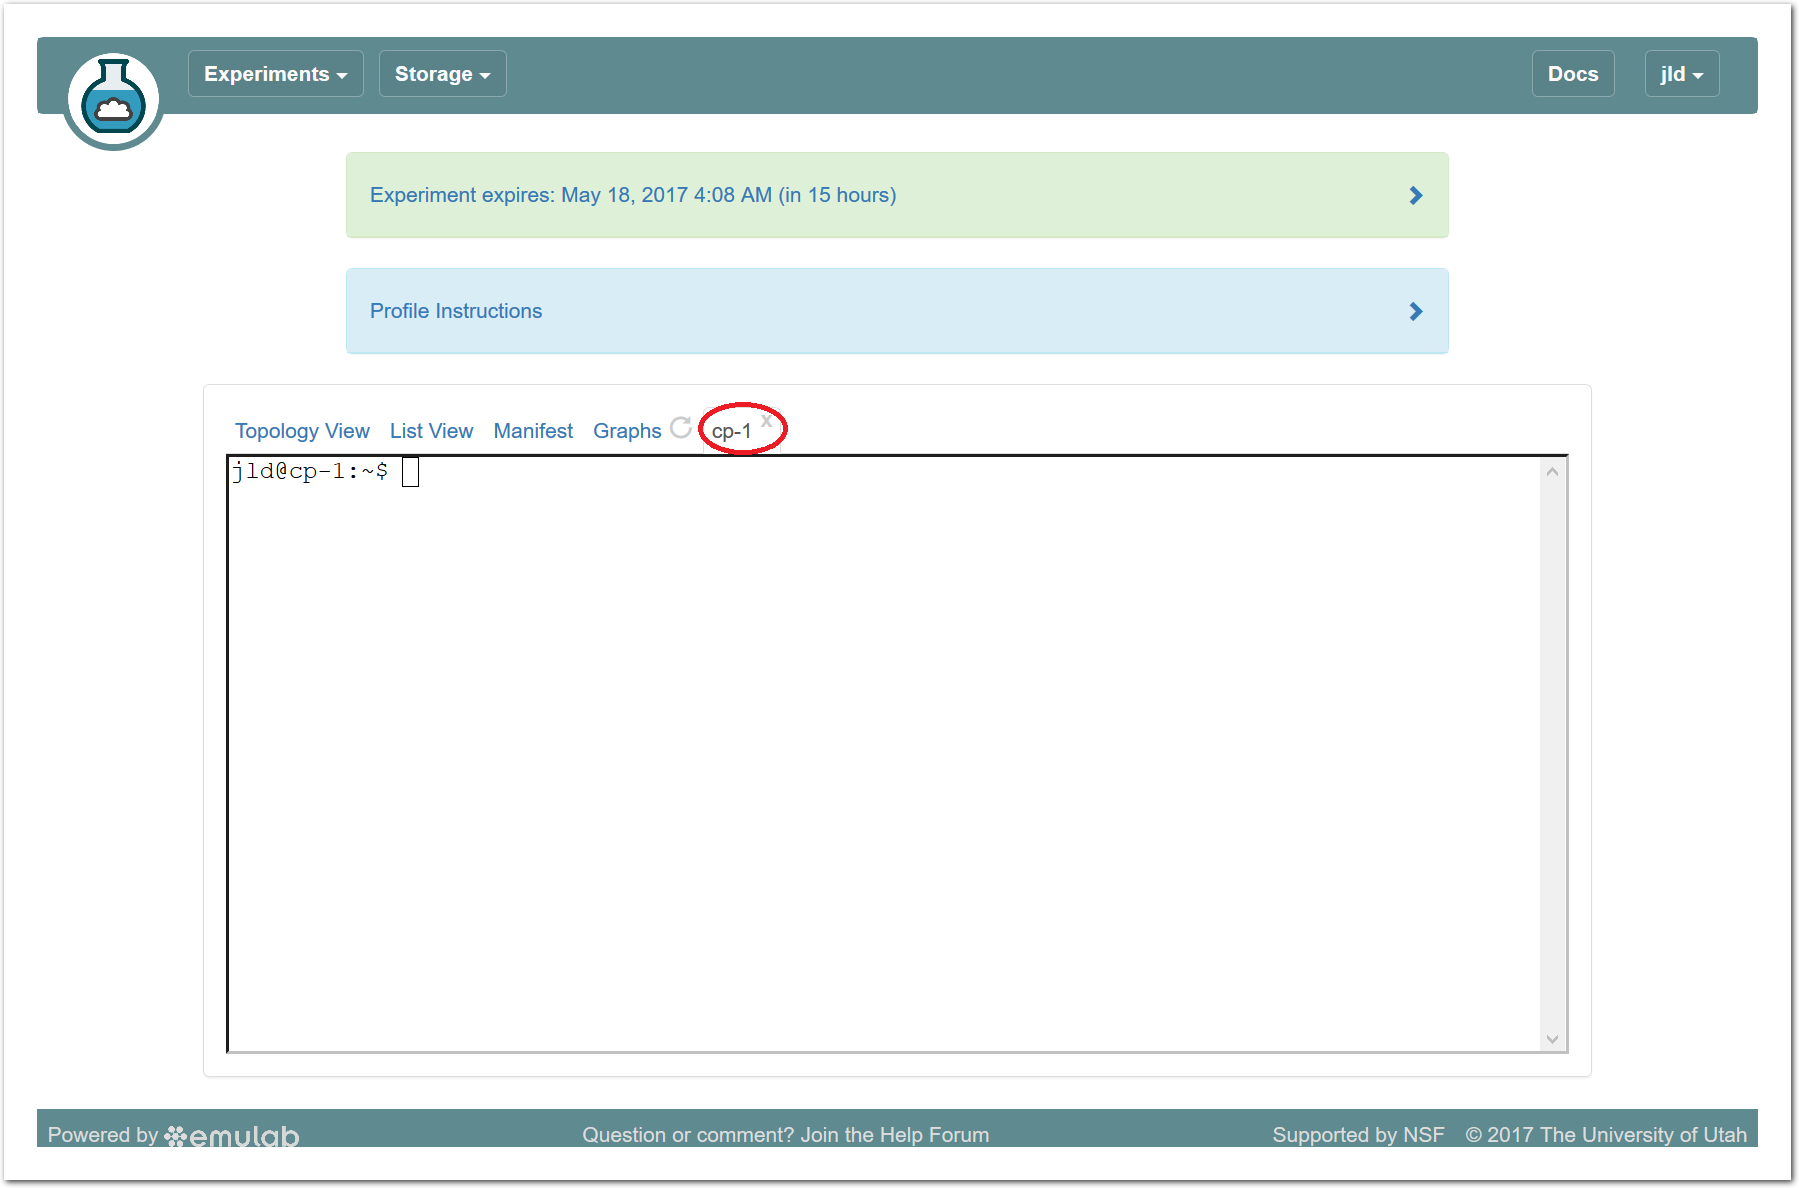
14.5.8 Web-based Shell
CloudLab provides a browser-based shell for logging into your nodes, which is accessed through the action menu described above. While this shell is functional, it is most suited to light, quick tasks; if you are going to do serious work, on your nodes, we recommend using a standard terminal and ssh program.
This shell can be used even if you did not establish an ssh keypair with your account.
Two things of note:
Your browser may require you to click in the shell window before it gets focus.
Depending on your operating system and browser, cutting and pasting into the window may not work. If keyboard-based pasting does not work, try right-clicking to paste.
14.5.9 Serial Console
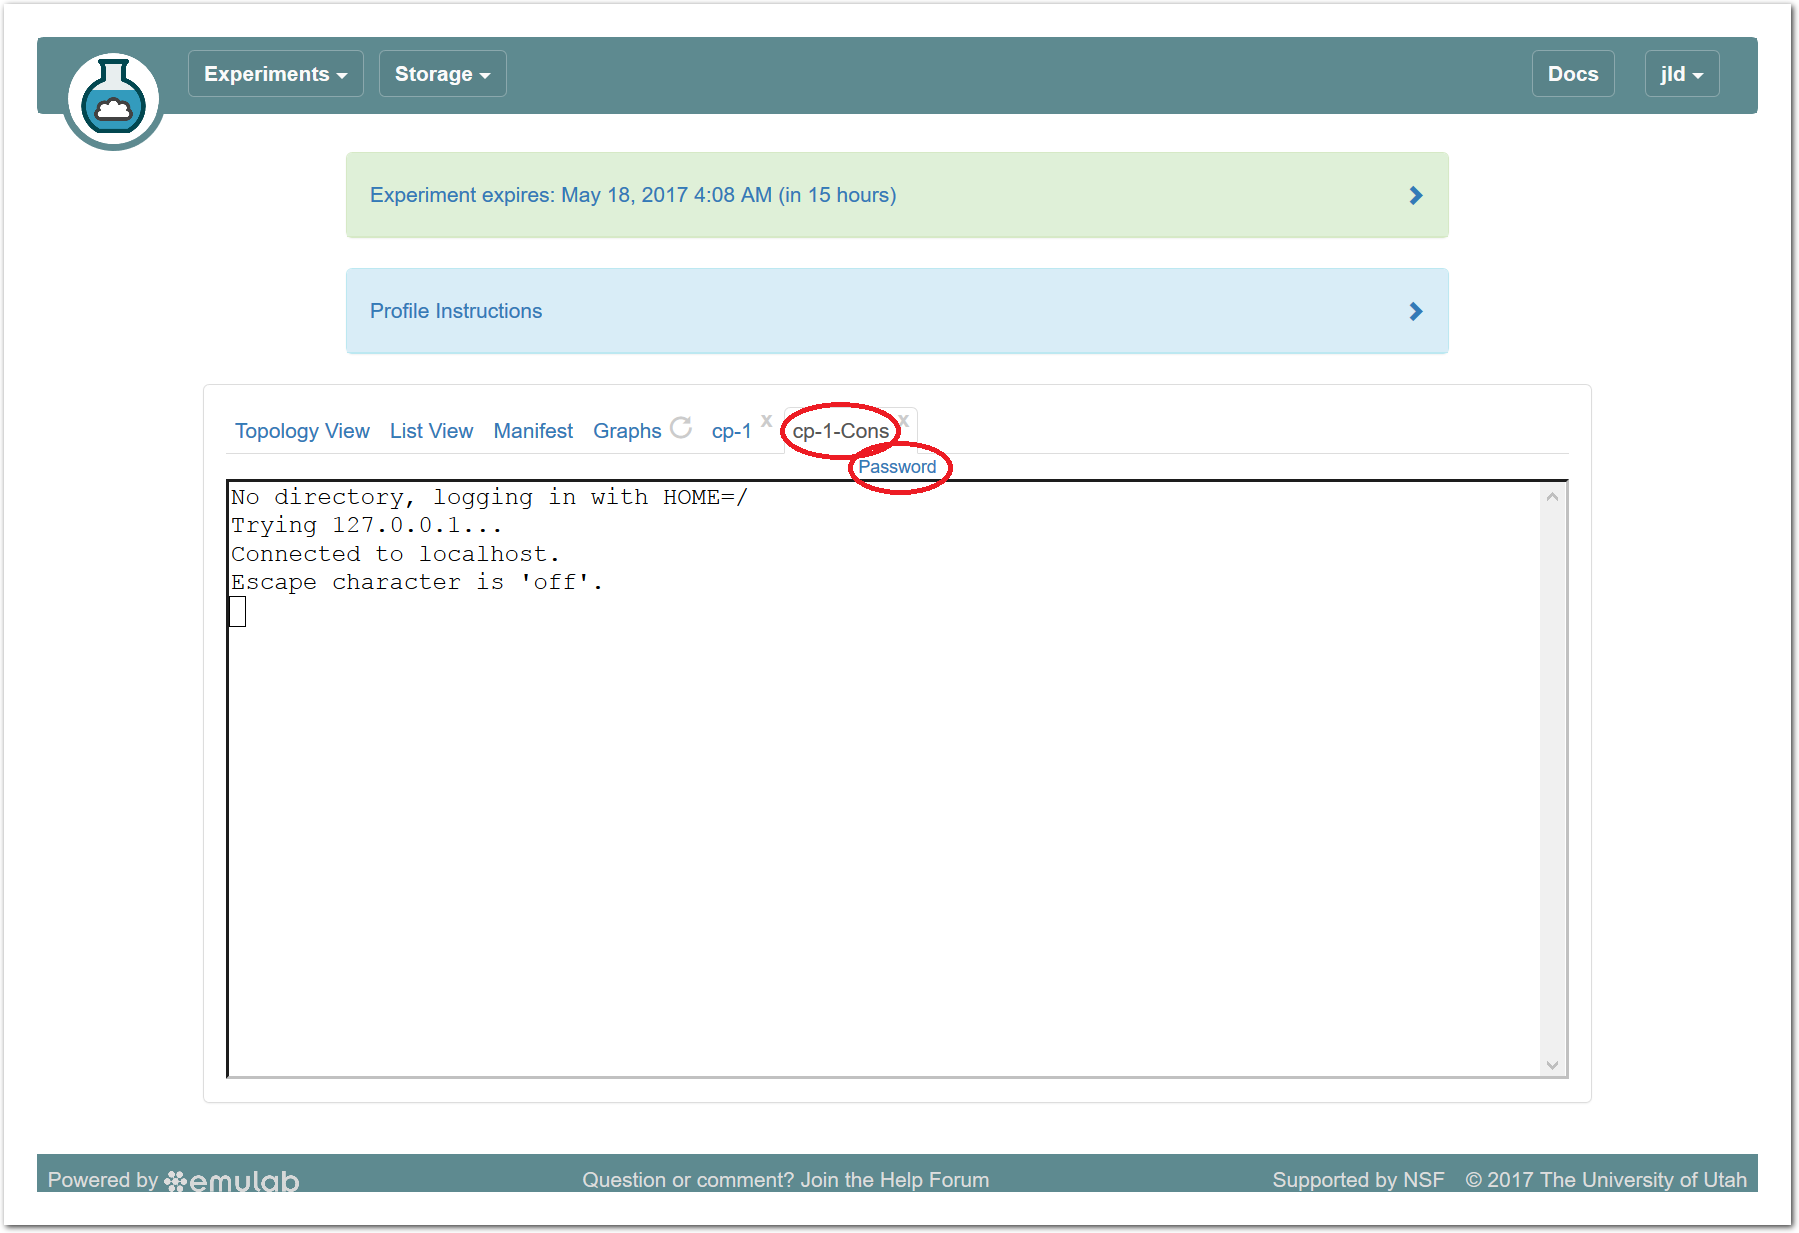
CloudLab provides serial console access for all nodes, which can be used in the event that normal IP or ssh access gets intentionally or unintentionally broken. Like the browser-based shell, it is launched through the access menu, and the same caveats listed above apply as well. In addition:
If you look at the console for a node that is already booted, the console may be blank due to a lack of activity; press enter several times to get a fresh login prompt.
If you need to log in, do so as root; your normal user account does not allow password login. There is a link above the console window that reveals the randomly-generated root password for your node. Note that this password changes frequently for security reasons.
14.6 Exploring Kubernetes
Now that you have your own copy of Kubernetes running, you can use it just like you would any other Kubernetes cluster, with the important property that you have full root access to every machine in the cluster and can modify them however you’d like.
14.6.1 Kubernetes Dashboard
Following the directions under the “Kubernetes credentials and dashboard access” portion of the profile instructions, click the link for the authentication token, which will be a URL leading to one of the CloudLab nodes in your experiment. You will be asked for a username (“admin”) and password (found in the profile instructions).
The admin password is randomly generated for each experiment.
Copy the entire contents of the file you are presented with, and go back to the profile instructions. Near the top of the “Kubernetes credentials ...” section, you will find a link to your dashboard, again hosted on one of the nodes in your experiment. Click the link (you may have to tell your browser to accept the self-signed TLS certificate) and you’ll see the Kubernetes dashboard login page.
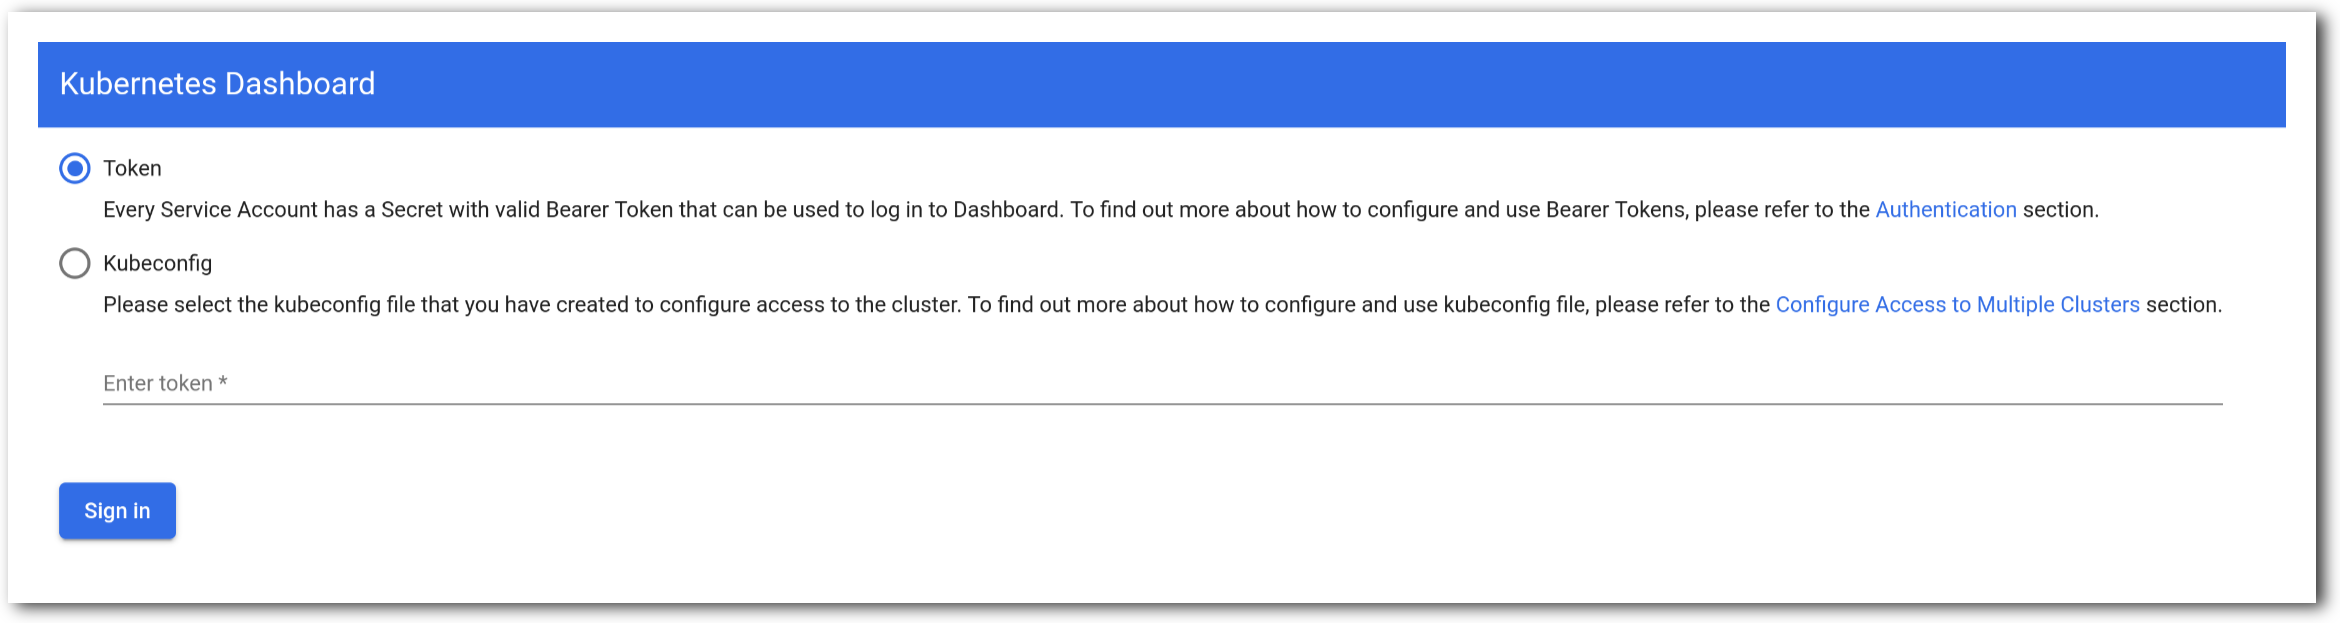
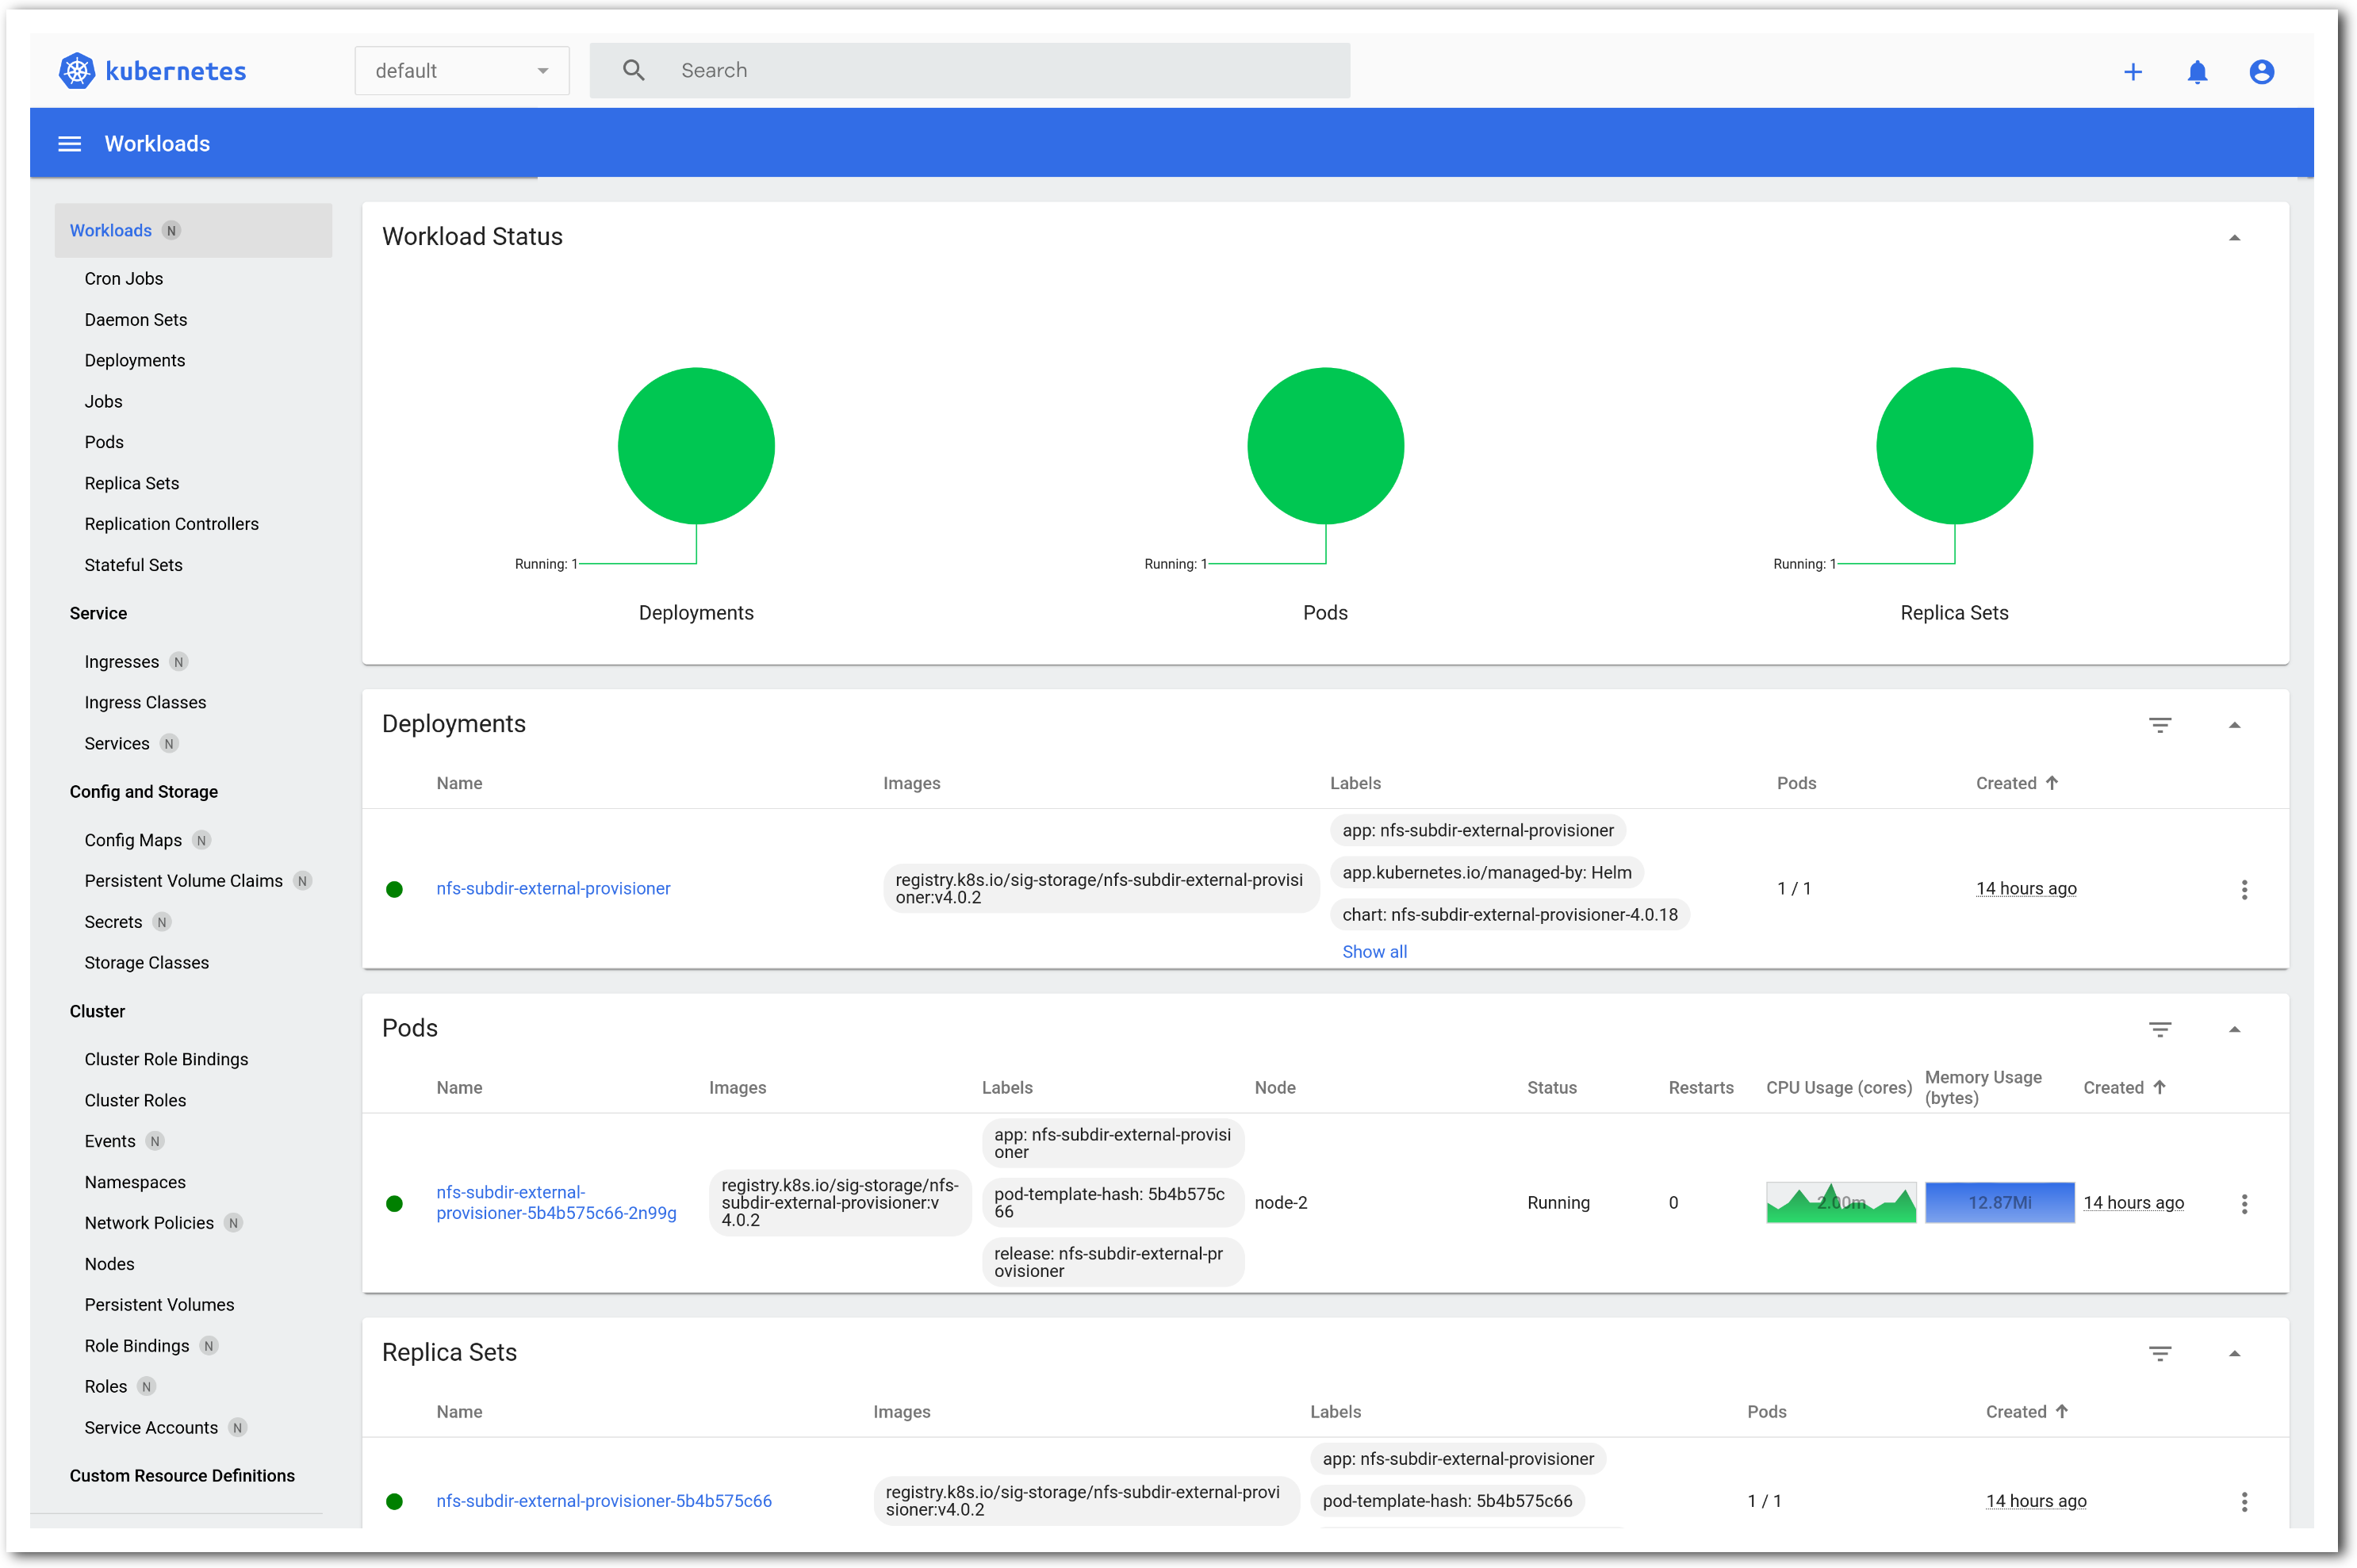
Make sure that “token” is selected and paste in the token you copied. Once logged in, you’ll be able to see the status of your cluster, including the current workload (there won’t be much running), the set of nodes, and much more.
14.6.2 Kubernetes Dashboard
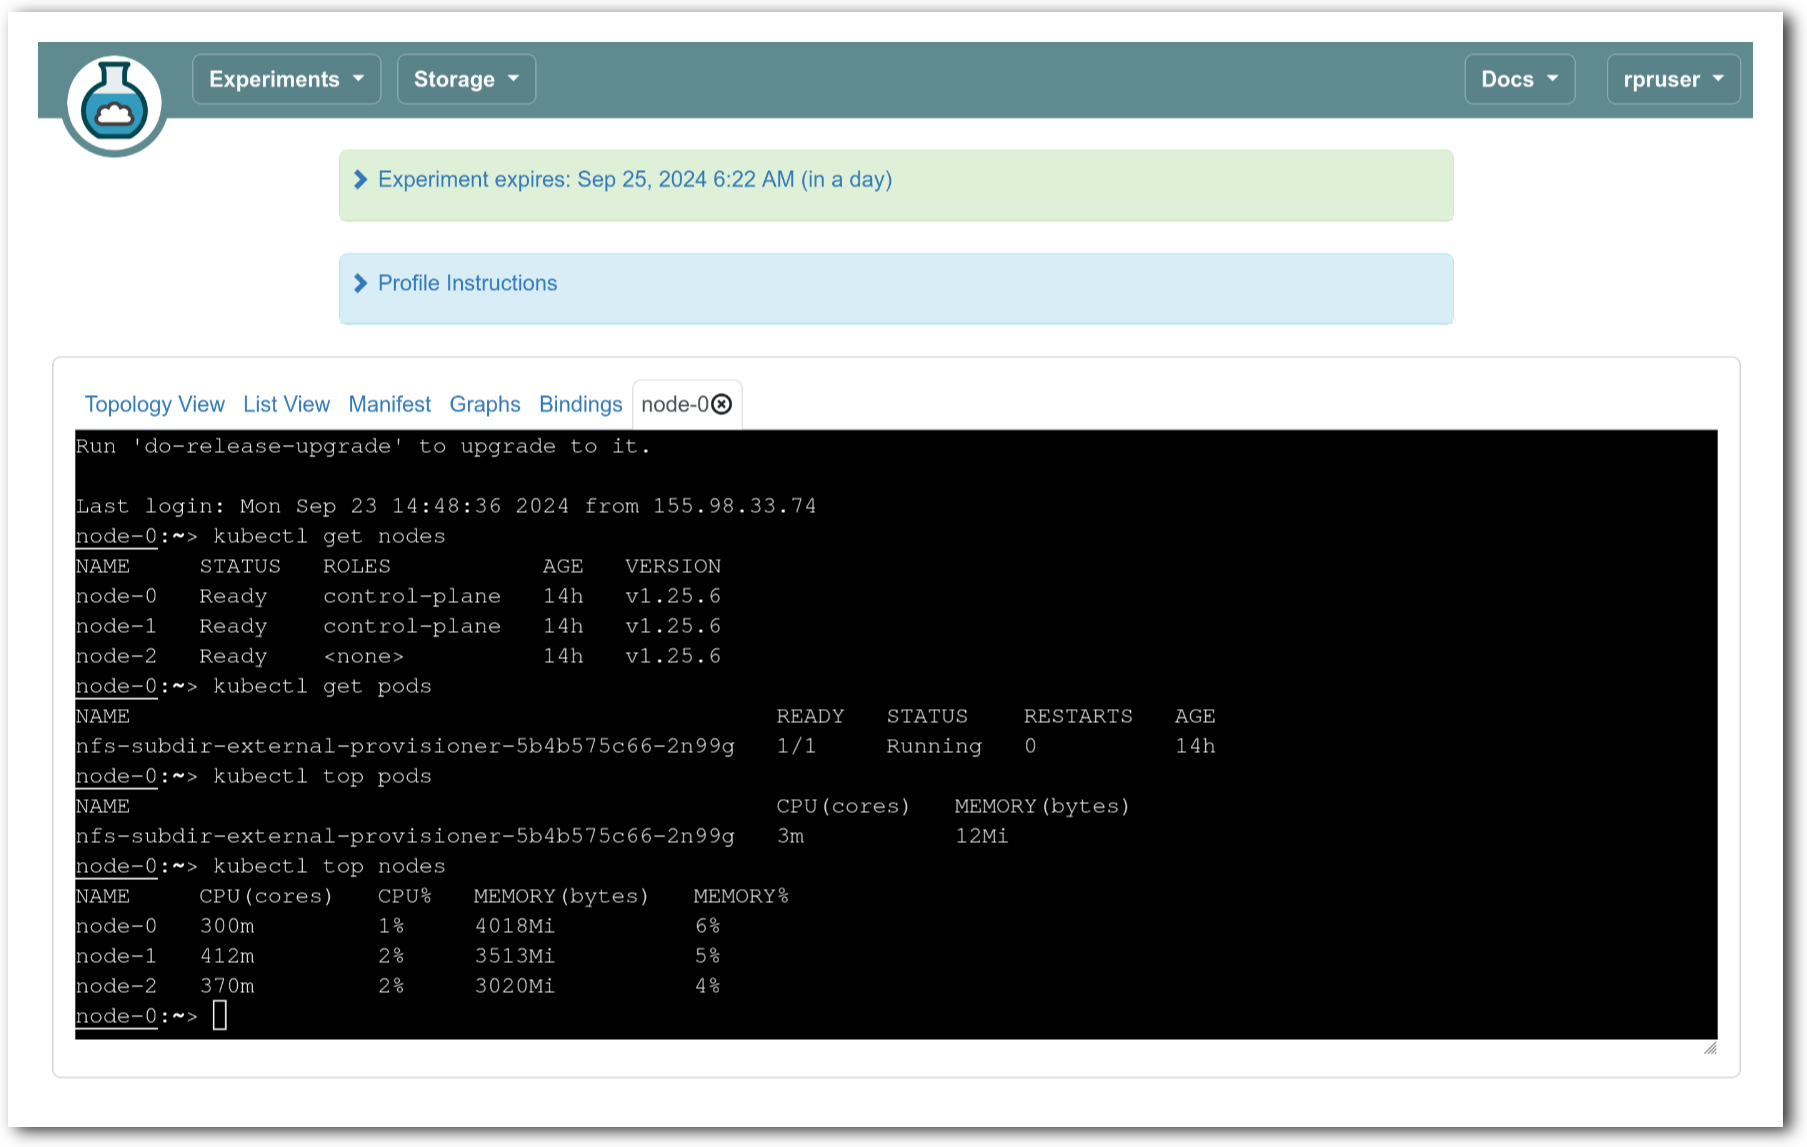
If you want to start jobs in Kubernetes, you’ll need to use the command line. Start a shell on “node-0” using the instructions above. You can run kubectl on these nodes; our profile also installs helm.
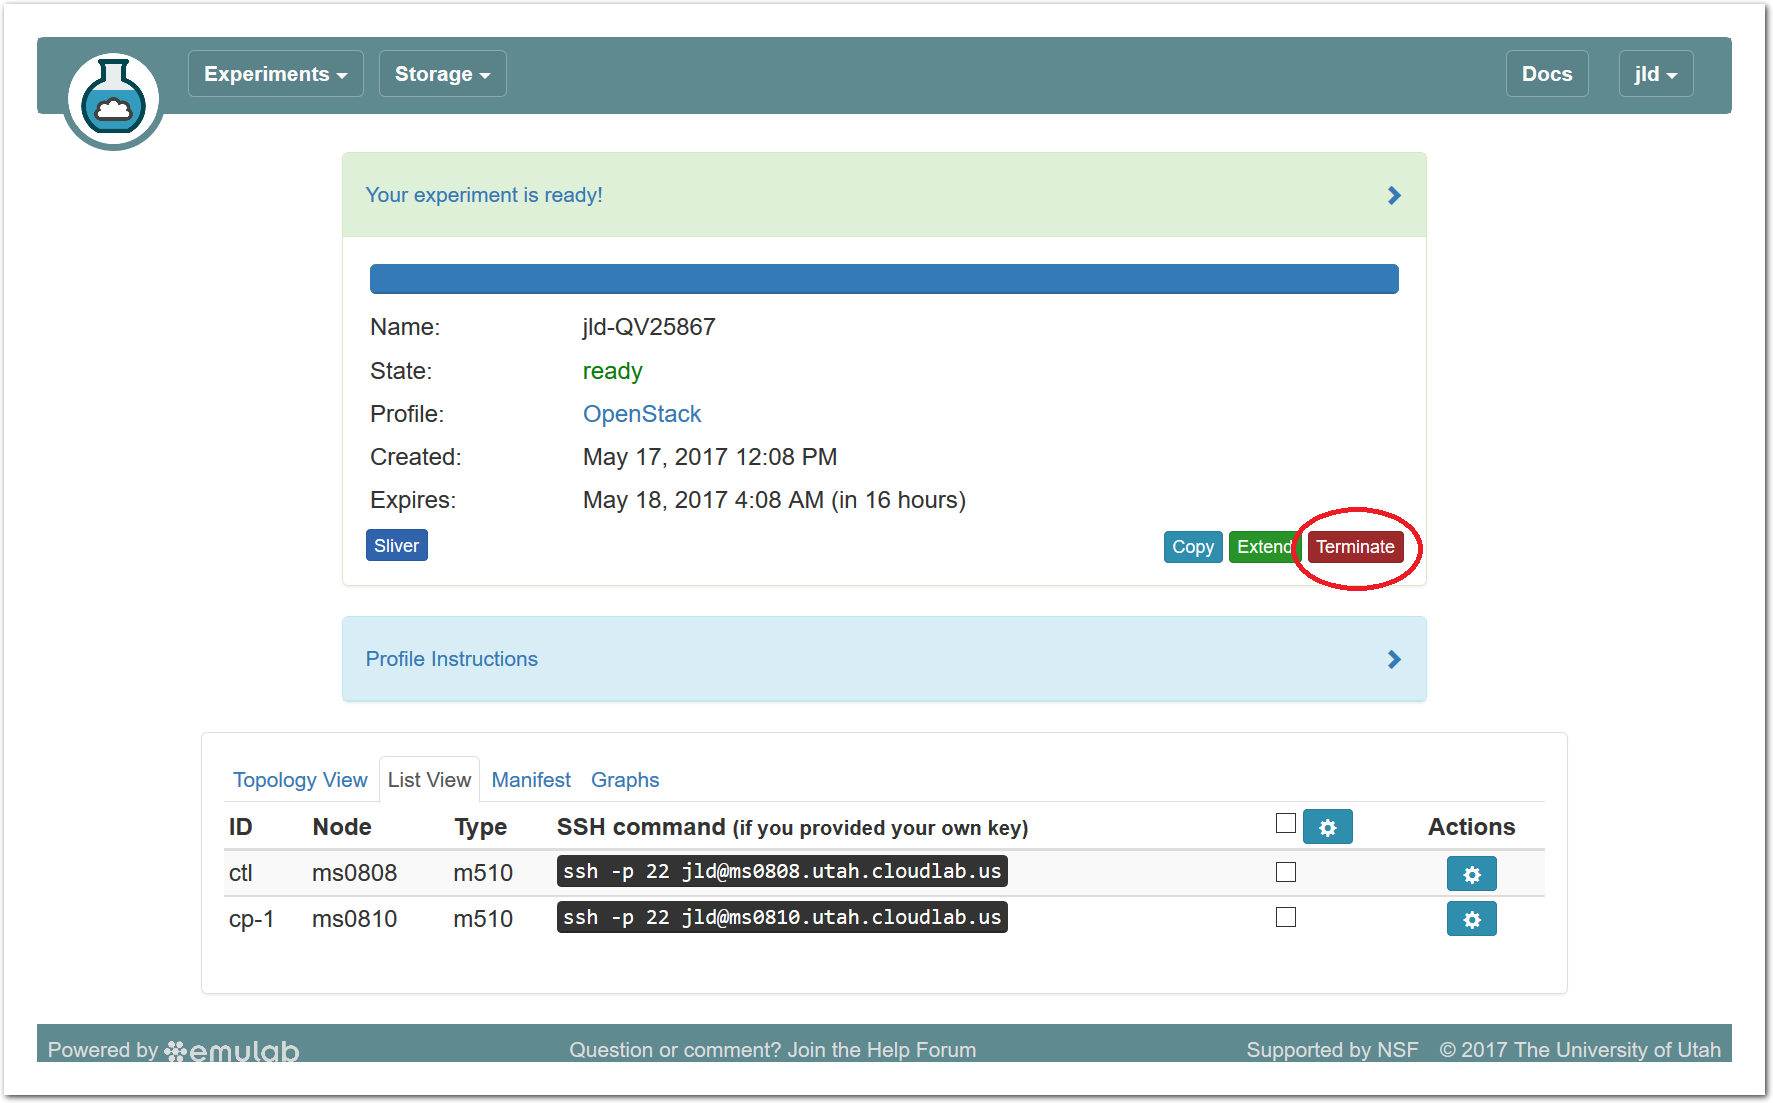
14.7 Terminating the Experiment
Resources that you hold in CloudLab are real, physical machines and are therefore limited and in high demand. When you are done, you should release them for use by other experimenters. Do this via the “Terminate” button on the CloudLab experiment status page.
Note: When you terminate an experiment, all data on the nodes is lost, so make sure to copy off any data you may need before terminating.
If you were doing a real experiment, you might need to hold onto the nodes for longer than the default expiration time. You would request more time by using the “Extend” button the on the status page. You would need to provide a written justification for holding onto your resources for a longer period of time.
14.8 Taking Next Steps
Now that you’ve got a feel for for what CloudLab can do, there are several things you might try next:
Create a new project to continue working on CloudLab past this tutorial
Try out some profiles other than k8s (use the “Change Profile” button on the “Start Experiment” page)
Read more about the basic concepts in CloudLab
Try out different hardware
Learn how to make your own profiles